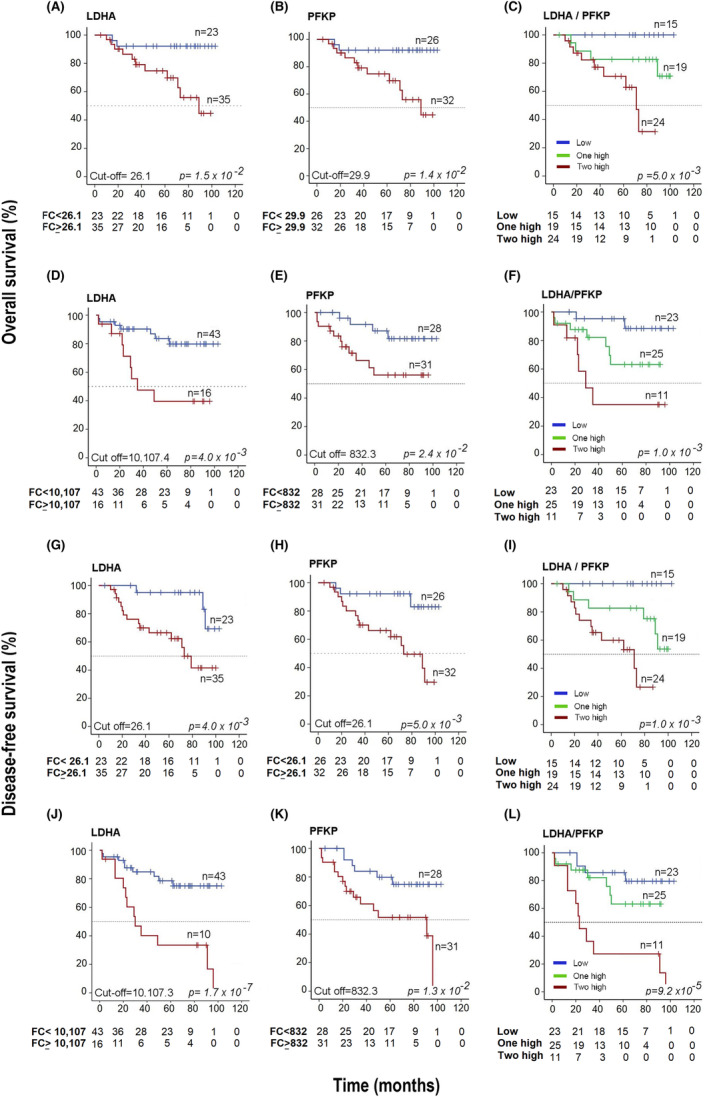
FIGURE 6.

Kaplan–Meier survival curves based on LDHA and PFKP expression. OS analysis according to the expression of LDHA and PFKP by qRT–PCR (panels A–C) and WB (panels D–F). DFS analysis according to the expression of LDHA and PFKP by qRT–PCR (panels G–I) and WB (panels J–L). The cutoff values were calculated using ROC curves. In the OS analysis, the red lines include the values of patients with overexpression of LDHA or PFKP, and the blue line includes the values of patients without overexpression of LDHA or PFKP (panels A, B, D, and E, respectively). In panels C and F, the red line includes the values of patients with overexpression of two markers (LDHA/PFKP), the green line includes the values of patients with overexpression of only one marker (LDHA or PFKP), and the blue line includes the values of patients when neither of these two markers was overexpressed. In the DFS analysis, the red lines contain the values of patients with LDHA or PFKP overexpression, while the blue lines include the values of patients without LDHA or PFKP overexpression (panels G, H, J, and K, respectively). In panels I and L, the red line includes the values of patients with overexpression of two markers (LDHA/PFKP), the green line includes the values of patients with overexpression of only one marker (LDHA or PFKP), and the blue line includes the values of patients when neither of these two markers was overexpressed. Censored patients are shown marked with vertical bars. The number of patients at risk in each time intervals are noted in the tables below the curves. The p value was calculated with the log‐rank test.
