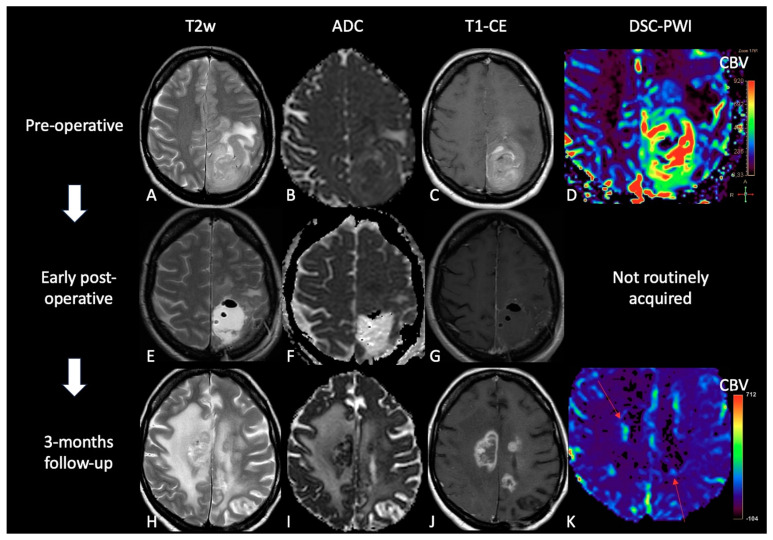
Figure 6.
Case of TP. (A,E,H): T2w axial images; (B,F,I) ADC maps; (C,G,J) post-contrast T1w images after contrast; (D,K) DSC-CBV maps. The upper row shows a left parietal GB, with low ADC, CE, and high perfusion values in the CBV map. In the middle row there are post-operative images of macroscopically complete tumor resection. The lower row shows images three months after Stupp treatment, highlighting the appearance of tissue with CE in different site from the surgical bed, with low ADC values and high rCBV values, suggesting TP.

