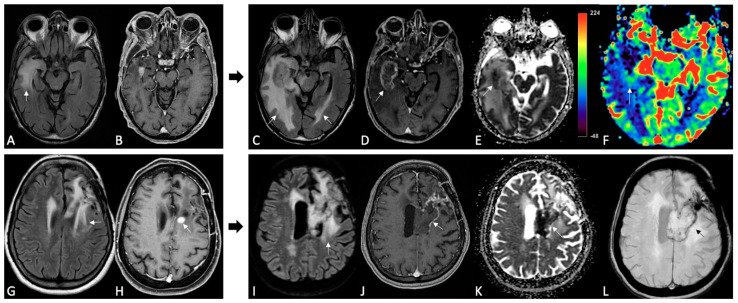
Figure 10.
MRI changes in recurrent GB under regorafenib, patterns A and B. MRI scans were performed at baseline (A,B,G,H) and 3 months after the first administration of REG therapy (C–F,I–L). FLAIR (A,C,G,I), post-contrast T1w (B,H,D,J), ADC map (E,K), DSC-CBV map (F) and SWI (L). Pattern A (upper row). The 3-month follow-up showed an increase in size, more than 50%, of FLAIR signal intensity and enhancing tumor in the right temporal lobe. Note the focal diffusion restriction on the ADC map and high rCBV within the enhancing areas. Pattern B (lower row). On 3-month follow-up MRI, the previously enhanced tumor component showed a dramatic reduction in the CE area with evidence of only subtle peripheral enhancement. Also, note the slight increase in FLAIR signal intensity, diffusion restriction on the ADC map (involving the corpus callosum) and a thin hypointense rim on SWI.

