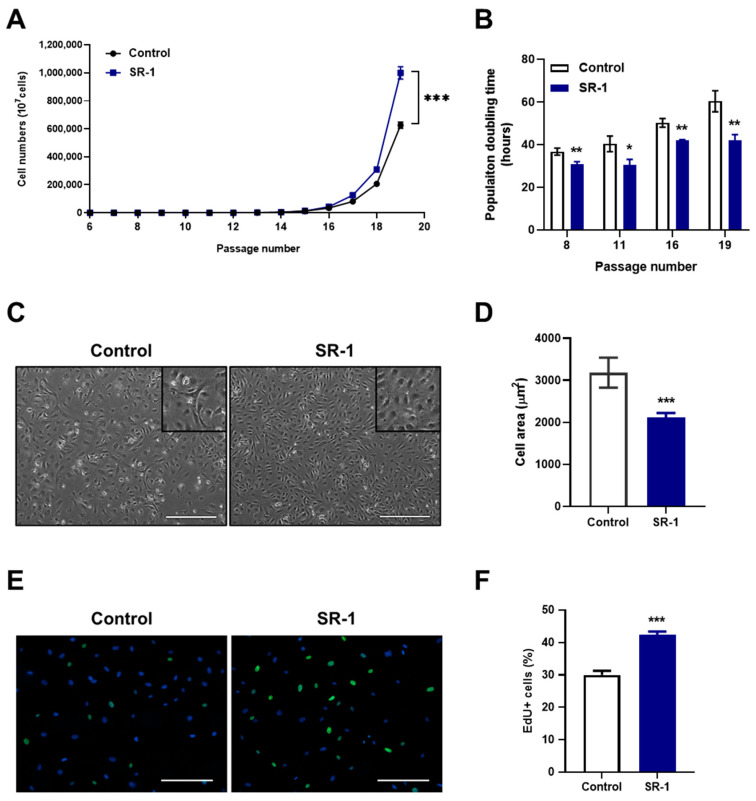
Figure 2.
Effects of SR-1 long-term treatment on EPCs properties. (A) The graph demonstrates accumulative cell numbers of continuous SR-1 treatment. (B) Population doubling time of SR-1-continuously treated EPCs. (C) Representative phase-contrast images for long-term culture of EPCs with continuous SR-1 treatment (Scale bar, 400 μm). The boxed regions are shown at a high magnification (×2) in the inset. (D) Cell morphometric parameters measuring cell area. (E) Merged images of EdU staining (green) and Hoechst-33342 (blue). (F) Quantitative assessments of EdU-positive cells. The data are presented as mean ± standard deviation. (* p < 0.05, ** p < 0.01 and *** p < 0.001 vs. control, SR-1 1 μM treatment).

