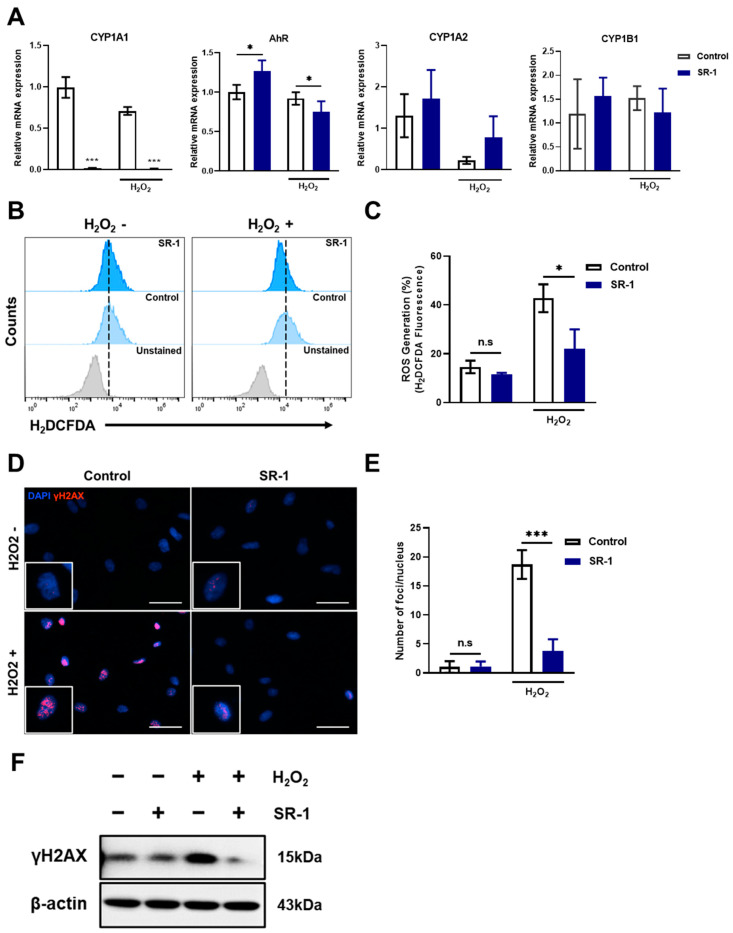
Figure 5.
Preservation of SR-1 against H2O2-induced oxidative stress in EPCs. (A) mRNA levels of AhR, CYP1A1, CYP1A2, and CYP1B1 were examined using qRT-PCR. The mRNA levels were normalized to GAPDH. (B) ROS production measured using flow cytometry analysis using H2DCFDA dye. (C) Percentages in the representative histograms indicated the percentage of ROS levels. (D) Representative images of γH2A.X (Red) and DAPI (Blue) staining in EPCs (scale bar, 40 μm). The boxed regions are shown at a high magnification (×2) in the inset. (E) γH2A.X foci number per nucleus. (F) The protein expression of γH2A.X were analyzed via Western blotting. The data are presented as mean ± standard deviation. (n.s represents no significance, * p < 0.05 and *** p < 0.001 vs. control, SR-1 1 μM treatment, H2O2 800 μM treatment for 30 min).

