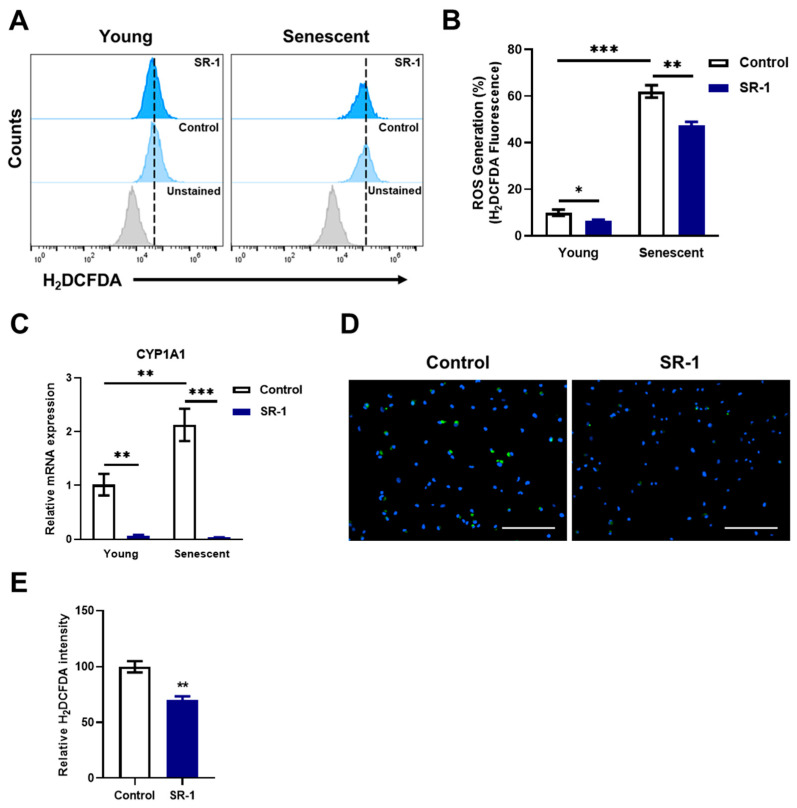
Figure 6.
Effect of SR-1 on replicative senescence through ROS accumulation. (A) Cellular ROS measured using flow cytometry analysis using H2DCFDA dye in young and senescent EPCs. (B) Percentages in the representative histograms indicate the percentage of accumulated ROS levels. (C) mRNA expression of accumulated CYP1A1 was examined by qRT-PCR. The mRNA levels were normalized to GAPDH. (D) Representative H2DCFDA (Green) fluorescence images in EPCs with continuous SR-1 treatment. The nucleus was stained by Hoechst-33342 (Blue) (Scale bar, 200 μm). (E) The quantified data of H2DCFDA fluorescence intensity. The data are presented as mean ± standard deviation. (* p < 0.05, ** p < 0.01 and *** p < 0.001 vs. control, SR-1 1 μM treatment).

