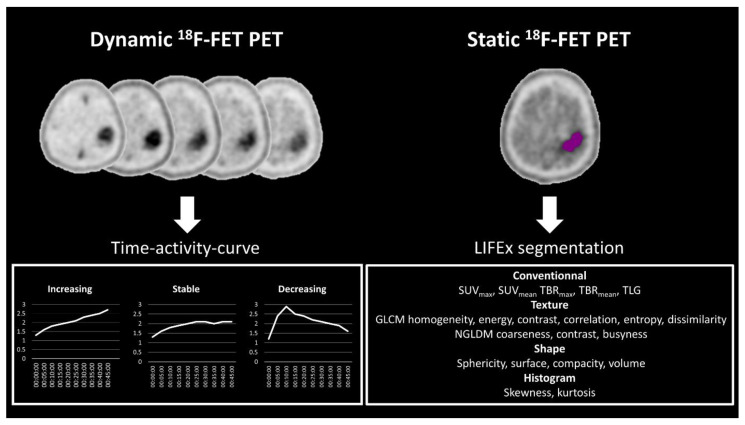
Figure 2.
Post-processing pipeline included analysis of the time–activity curves derived from the dynamic 18F-FET PET data on the left with three types: increasing, stable and decreasing. On the right, the texture parameters are shown that were obtained from the static analysis using the LIFEx© software. SUV, standardized uptake value; TBR, tumor-to-background ratio; TLG, total lesion glycolysis; GLCM, grey-level co-occurrence matrix; NGLDM, neighboring gray-level dependence matrix.

