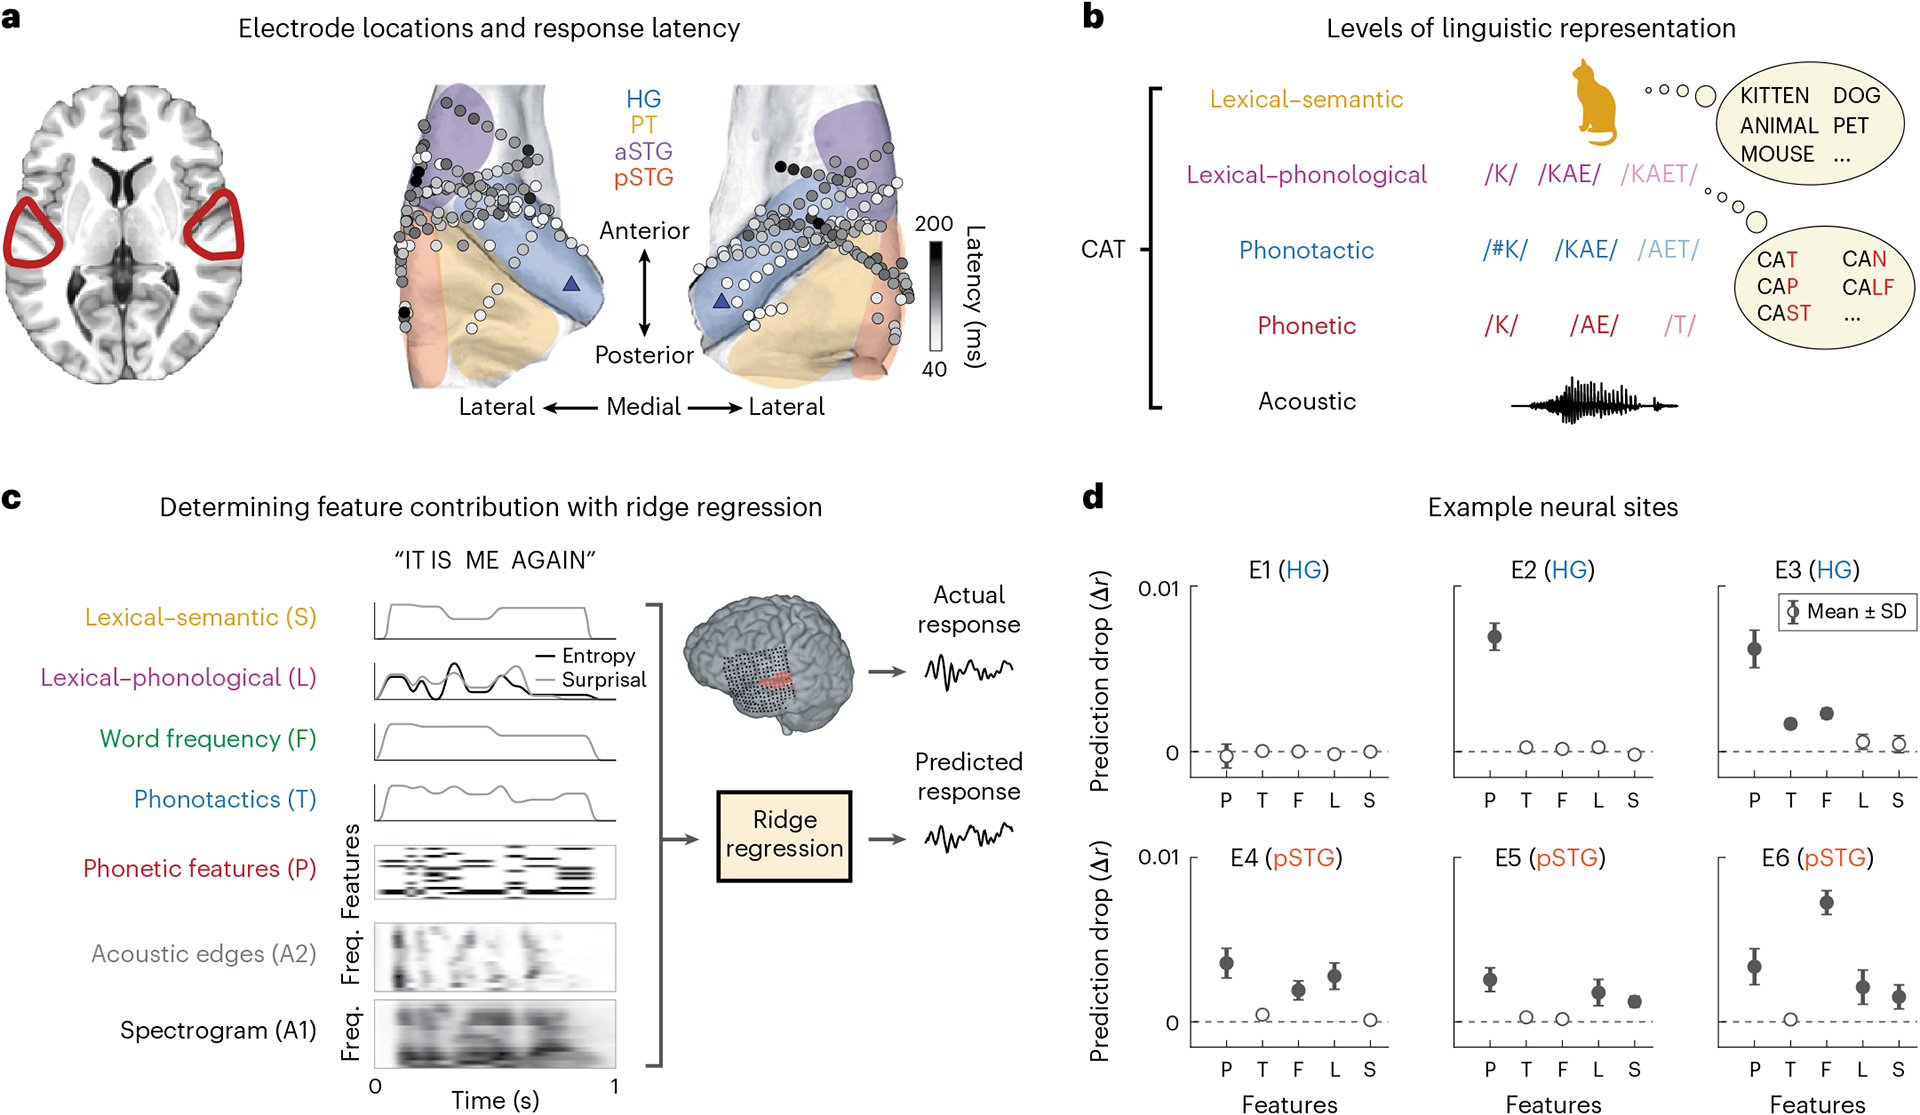
Fig. 1 |. Coverage and paradigm.

a, Electrode coverage and response latencies shown for 15 neurosurgical patients on the average FreeSurfer brain. The shaded regions indicate the general area of regions of interest. The blue triangles on the posteromedial HG sections indicate the reference point used for calculating distance from PAC. b, Different levels of linguistic features for the example word ‘cat’. c, Fitting TRFs using ridge regression for quantifying linguistic feature encoding in neural data. For each linguistic feature f, one at a time, we replaced that feature with a control variable , generated by permuting values of that feature across the language. We then compared the accuracy of predicting the neural data with the true predictors versus control predictors where only f has been replaced with . We repeated the process 100 times for each feature. d, Mean and standard deviation of the distribution of differences between true and control prediction accuracy (Δrc) for six example electrodes. Zero indicates that the control model performed the same as the true model, while positive values indicate that the true model outperformed the control model. We performed a one-sample t-test for each of the distributions against zero (P/T/F/L/S t values: E1, −3.46/2.32/0.76/−7.25/−0.22; E2, 80.38/11.66/9.09/7.56/−13.21; E3, 52.63/54.36/64.16/11.72/7.96; E4, 37.58/18.00/30.59/32.63/5.11; E5, 33.24/10.15/9.61/20.96/31.93; E6, 29.34/4.99/93.65/19.31/19.50). The filled circles indicate that a feature was determined to be significantly encoded at the electrode site (t > 19).
