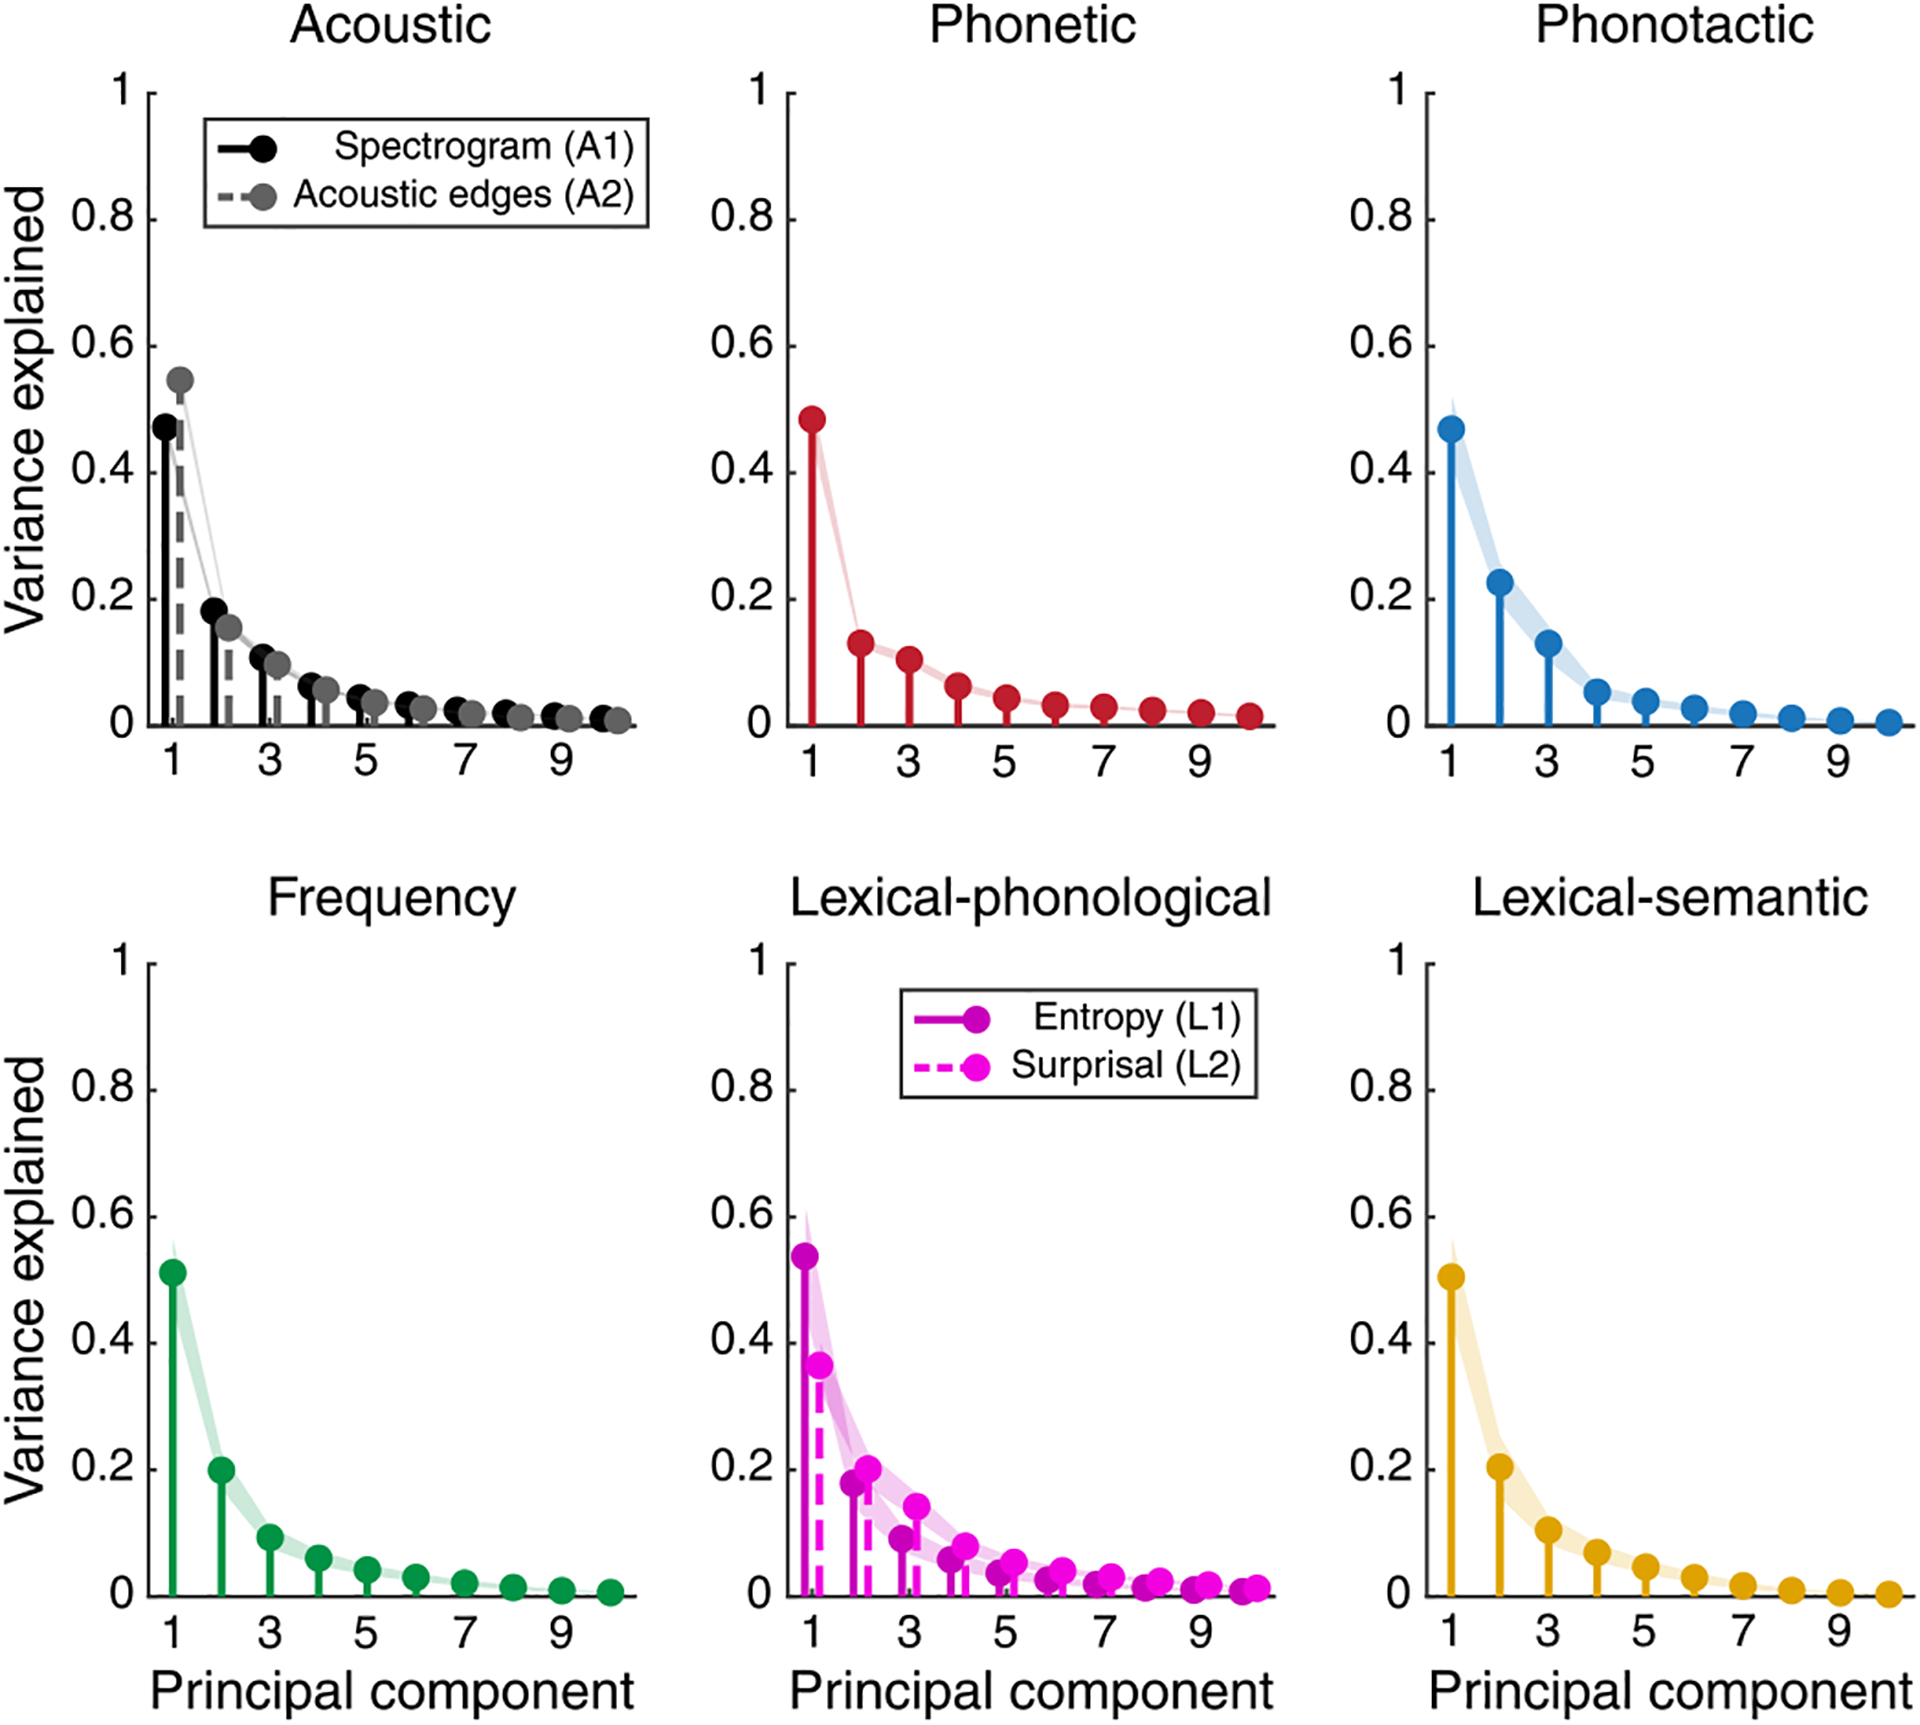
Extended Data Fig. 6 |. Explained variance of TRF diversity.

The bootstrapped (n = 1000) PCA analysis in Fig. 3 generates multiple eigenvectors at each bootstrap sample. We use the eigenvector that captures the most variance for computing the time courses (3a) and peak latencies (3b). This plot shows the mean and standard deviation of the explained variance for each of the top-10 principal components, computed using the same bootstrap procedure. In all cases, the first principal component captures roughly half of the total variance across all electrodes.
