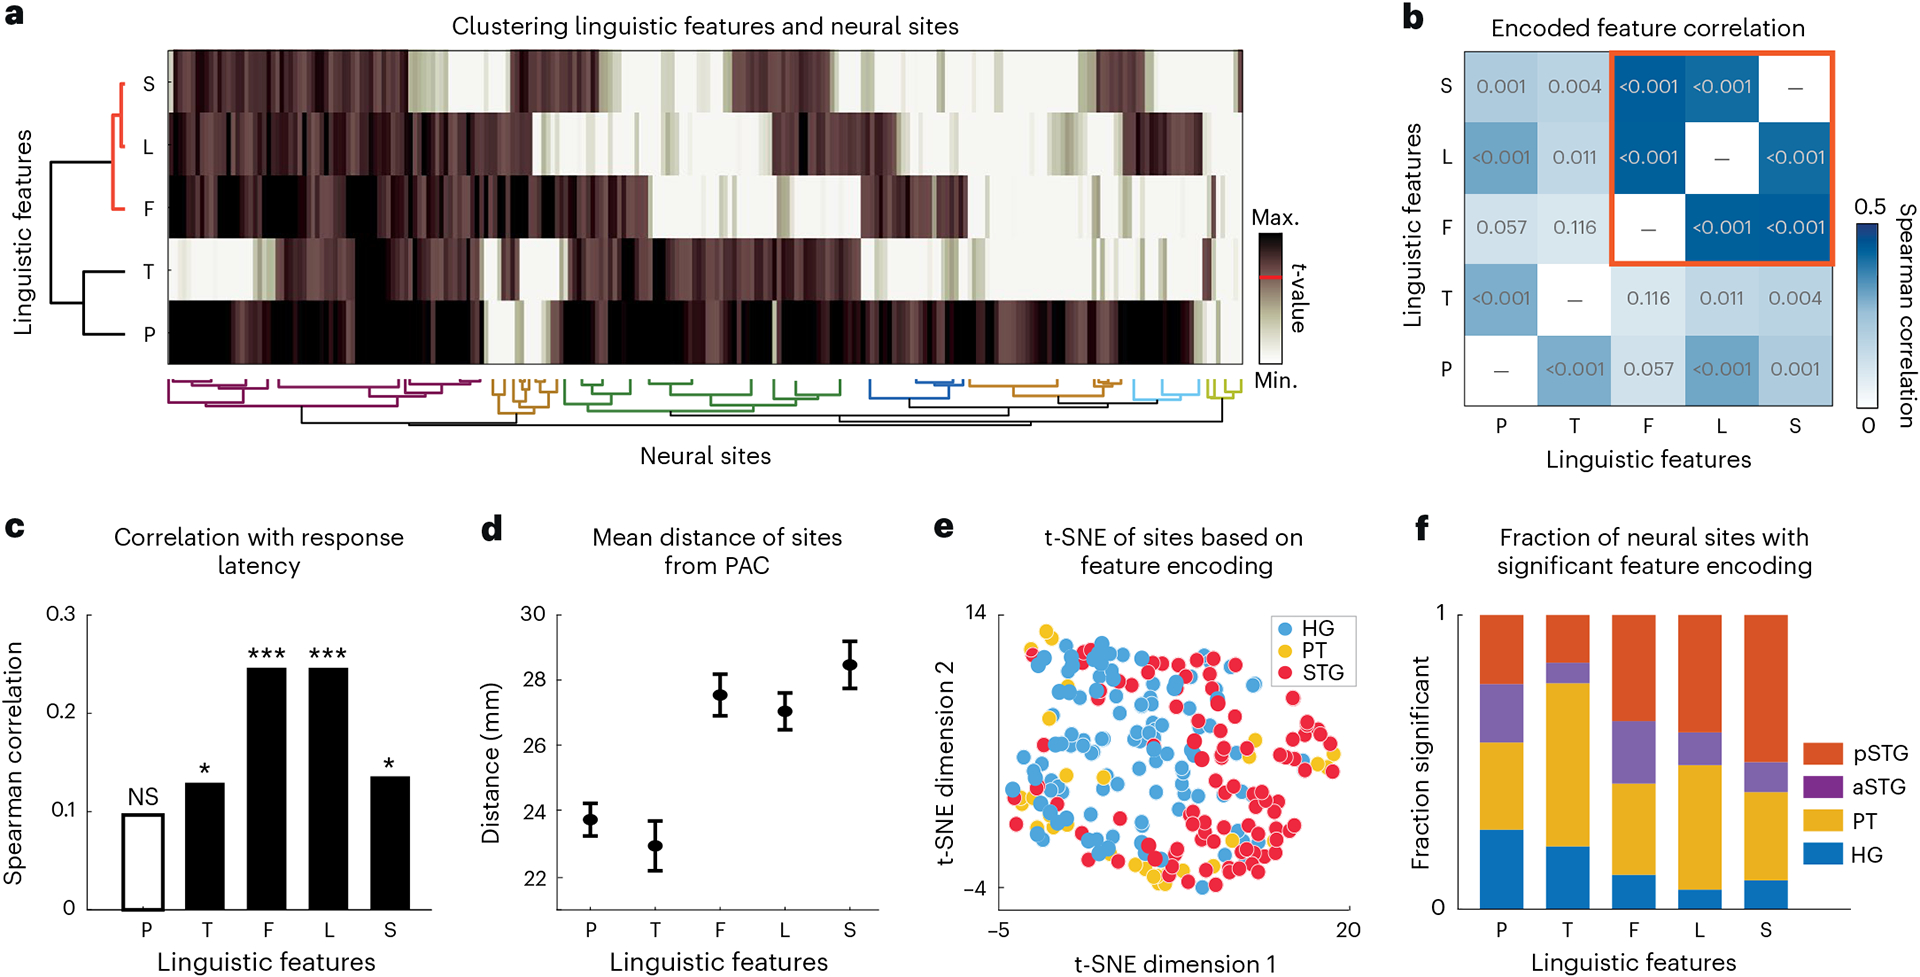
Fig. 2 |. Diversity in linguistic feature encoding.

a, Agglomerative clustering of the t values of prediction improvements over the corresponding control distribution (Fig. 1d) for all features and electrodes. Small values were clipped (white) and large values were compressed (dark brown) to reduce noise in clustering (Methods). The red horizontal line on the colour scale denotes the significance threshold (t > 19). b, Pairwise Spearman correlations between t values of different features computed across electrodes. The red square indicates lexical-level features (frequency, lexical–phonological and lexical–semantic) that are more highly correlated with each other. The values inside the boxes are the P values of the correlations. c, Spearman correlations of different feature encoding t values with neural response latencies of the electrodes (P values: P, 0.134; T, 0.044; F, <0.001; L, <0.001; S, 0.035). *P < 0.05; ***P < 0.001; NS, not significant. d, Mean and standard error of electrode distance from posteromedial HG (TE1.1) as a reference for the PAC. For each feature, we measured the mean and s.e. over the subset of electrodes that significantly encode that feature (t > 19; sample sizes: P, 174; T, 51; F, 73; L, 55; S, 32 electrodes). e, t-distributed stochastic neighbour embedding (t-SNE) representation of feature encoding values from a. The colours indicate brain regions. f, The normalized fraction of electrodes in each brain region significantly encoding the corresponding feature (t > 19; sample sizes: HG, 113; PT, 32; aSTG, 46; pSTG, 51 electrodes). First, the fraction of neural sites in each region that significantly encode a particular feature is calculated. Next, this fraction is normalized by the sum of all fractions across regions.
