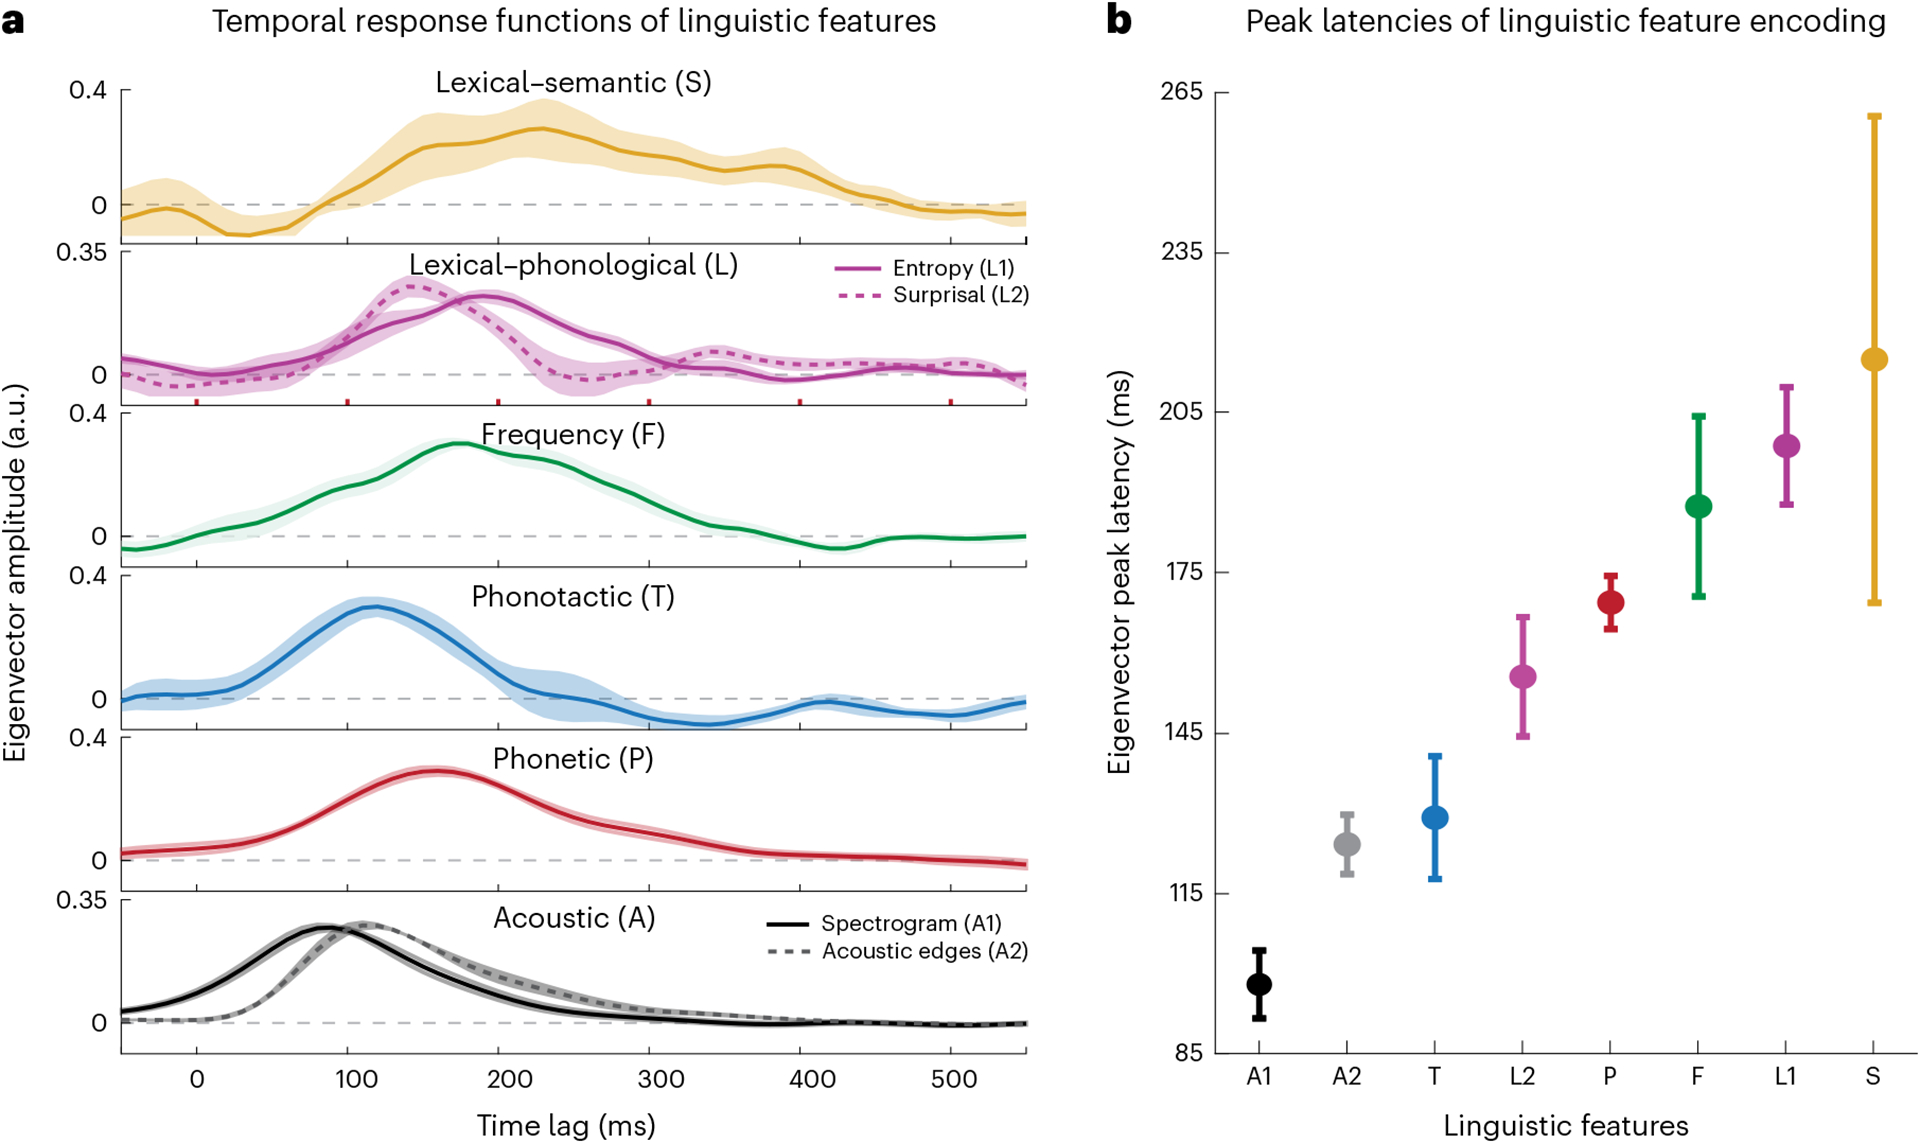
Fig. 3 |. Temporal profile of linguistic feature encoding.

a, Mean (lines) and standard deviation (shading) of the first eigenvector of the regression weights assigned to each linguistic feature computed over all neural sites that showed significant encoding for that feature (t > 19; sample sizes: A1/2, 242; P, 174; T, 51; F, 73; L1/2, 55; S, 32 electrodes). The statistics were calculated using a 1,000-sample bootstrap. b, Mean and standard deviation of the peak latencies of the first PCs computed in a (n = 1,000 bootstraps).
