
Fig. 4 |. Spatial profile of linguistic feature encoding.
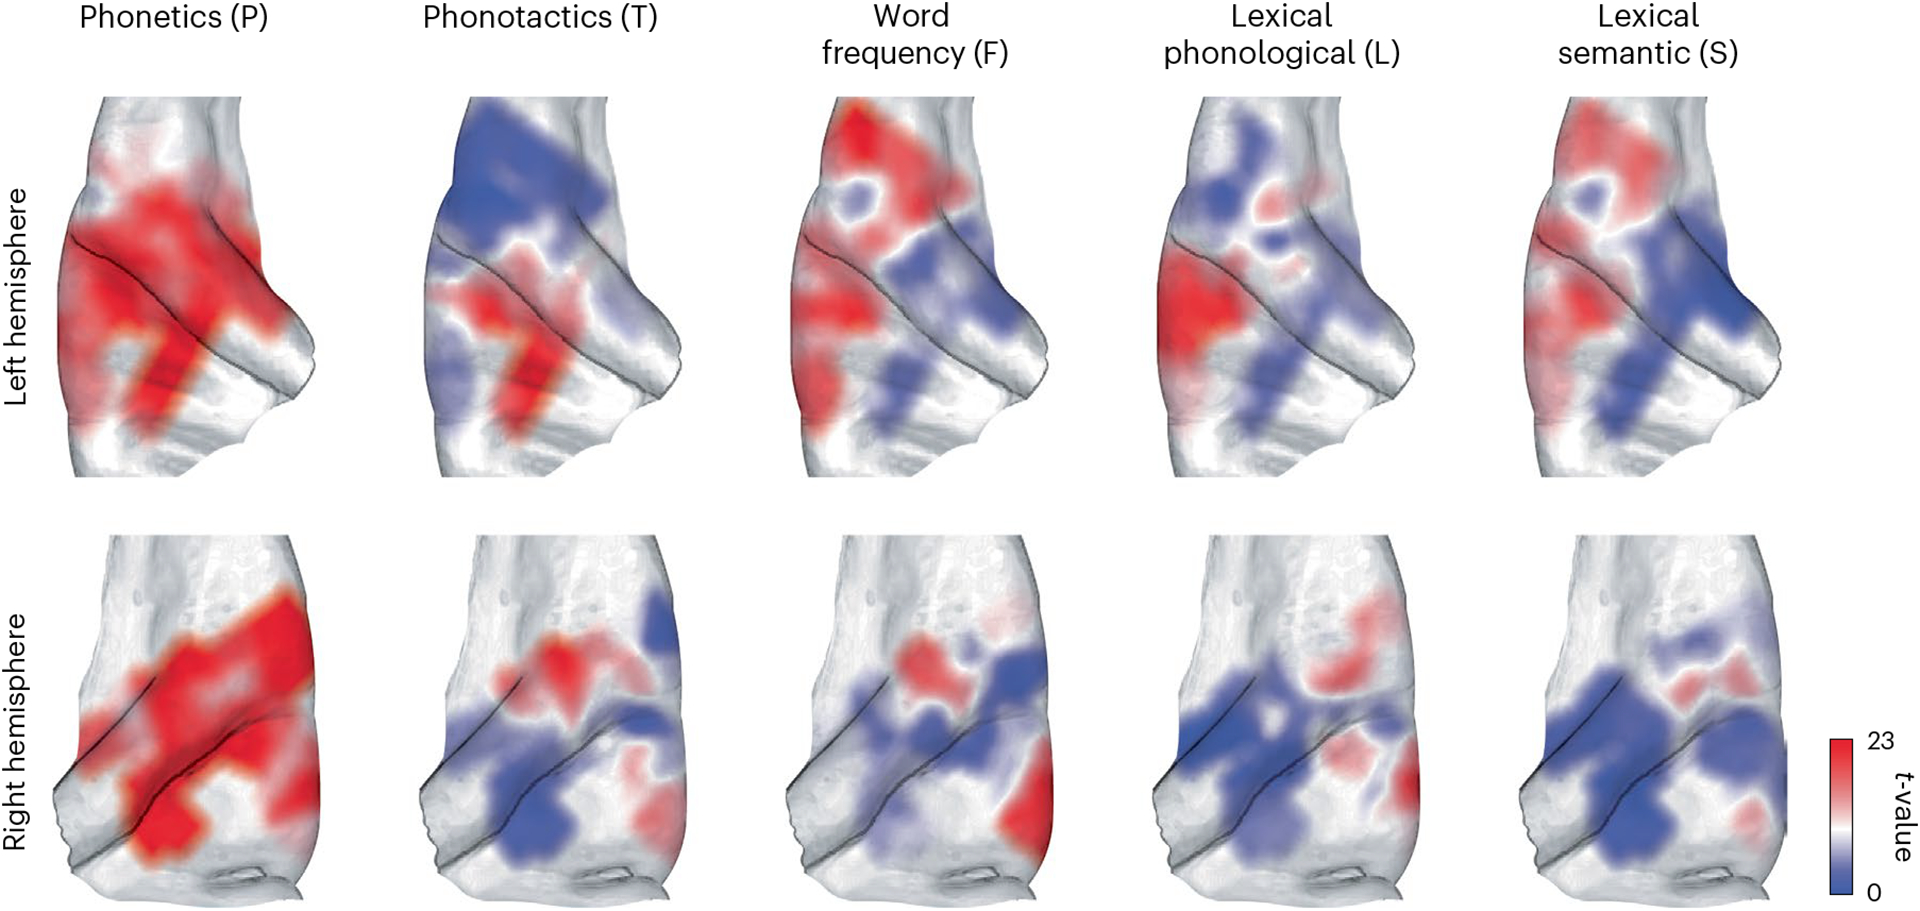
Interpolated two-dimensional maps of t statistics representing linguistic feature encoding across the auditory cortex. The interpolation was performed using k-nearest neighbours (k = 5). Interpolated t values greater than 23 are shown with the same dark red and those less than 0 are shown with the same dark blue. Darker shades of red indicate stronger encoding of the corresponding feature by neighbouring electrodes.