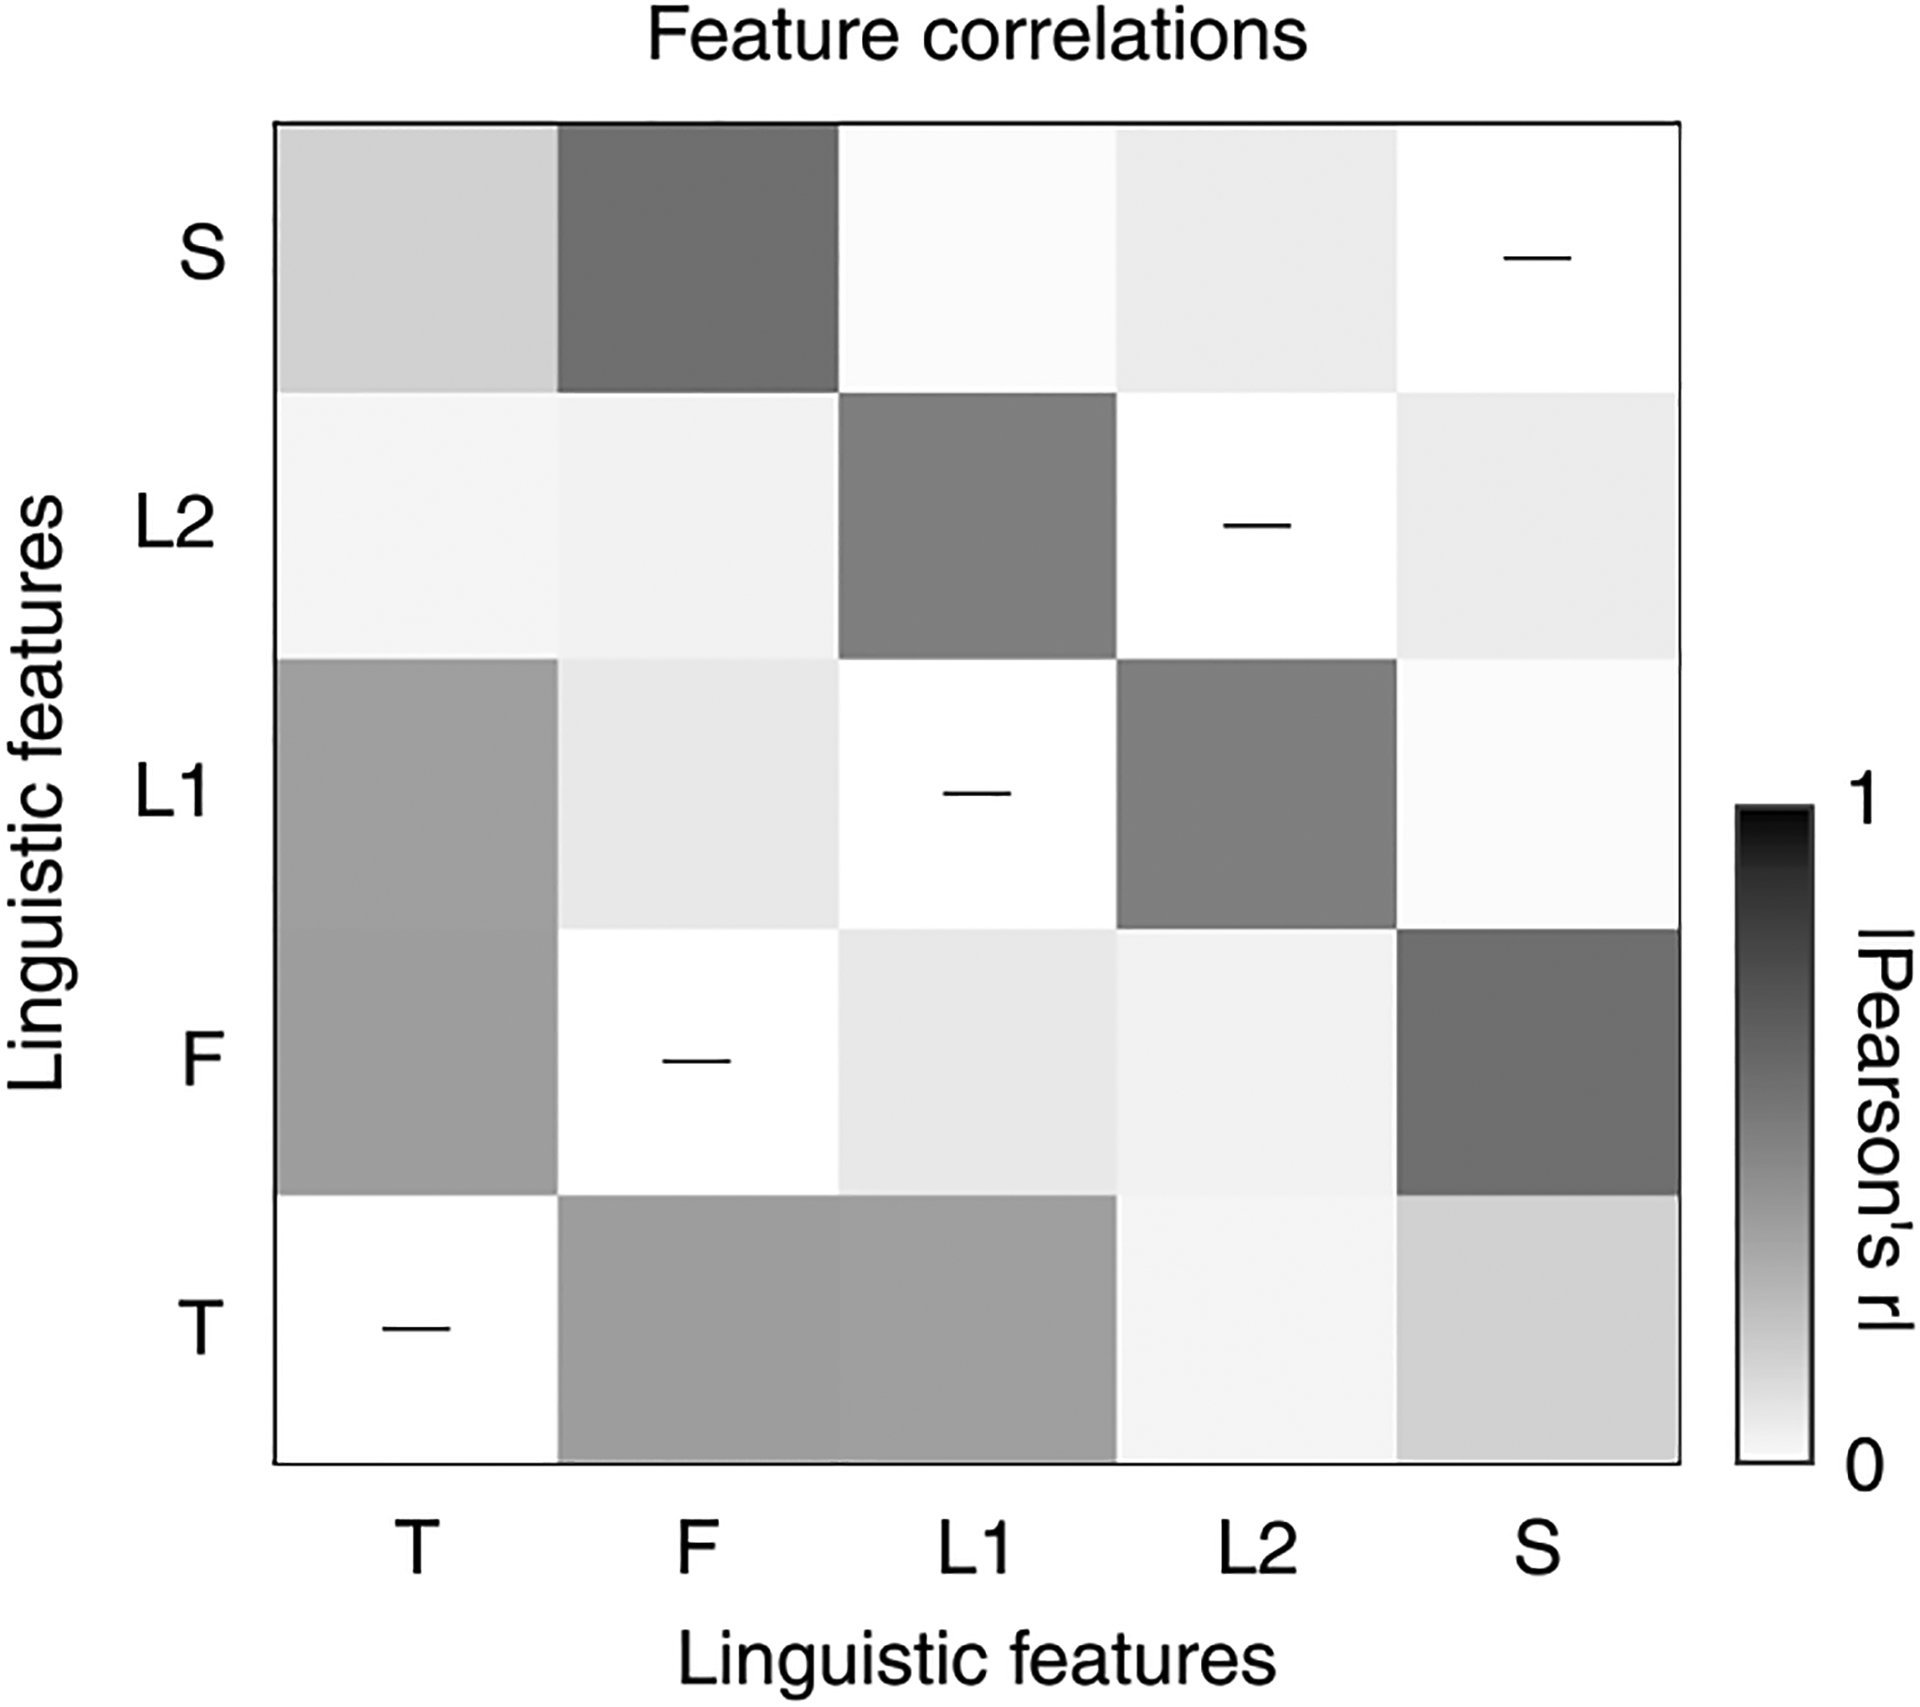
Extended Data Fig. 5 |. Correlations among features.

The linguistic features defined in this study are themselves correlated with each other. This plot shows the absolute value of the Pearson correlation coefficient for all pairs of 1-dimensional linguistic features (22-dimensional phonetic features excluded from figure; L1: lexical entropy, L2: lexical surprisal). The correlations are computed on the same 30-minute dataset used for all other analyses. All correlations are statistically significant (p < 0.001).
