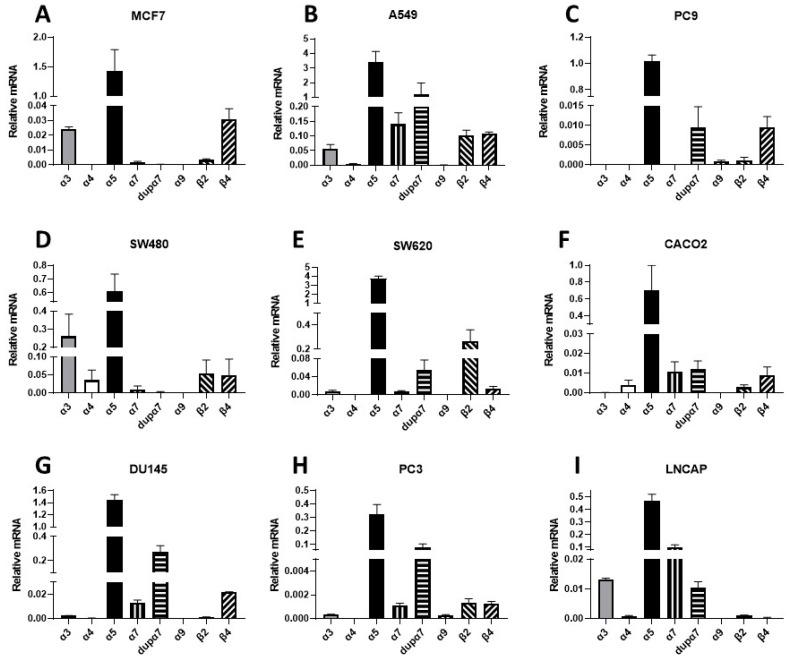
Figure 2.
Cell-specific expression patterns of transcripts for nAChR subunits. Human cell lines examined: MCF7 (A), breast cancer), A549 (B), lung cancer), PC9 (C), lung cancer), SW480 (D), colorectal cancer), SW620 (E), colorectal cancer), CACO2 (F), colorectal cancer), DU145 (G), prostate cancer), PC3 (H), prostate cancer), and LNCAP (I), prostate cancer). The gene expression profiles were investigated via qPCR analysis. Bar graphs show the relative expression ± SEM of each subunit normalized to endogenous TATA-binding protein expression. Measurements were made using 3–5 independent experiments performed in triplicate.

