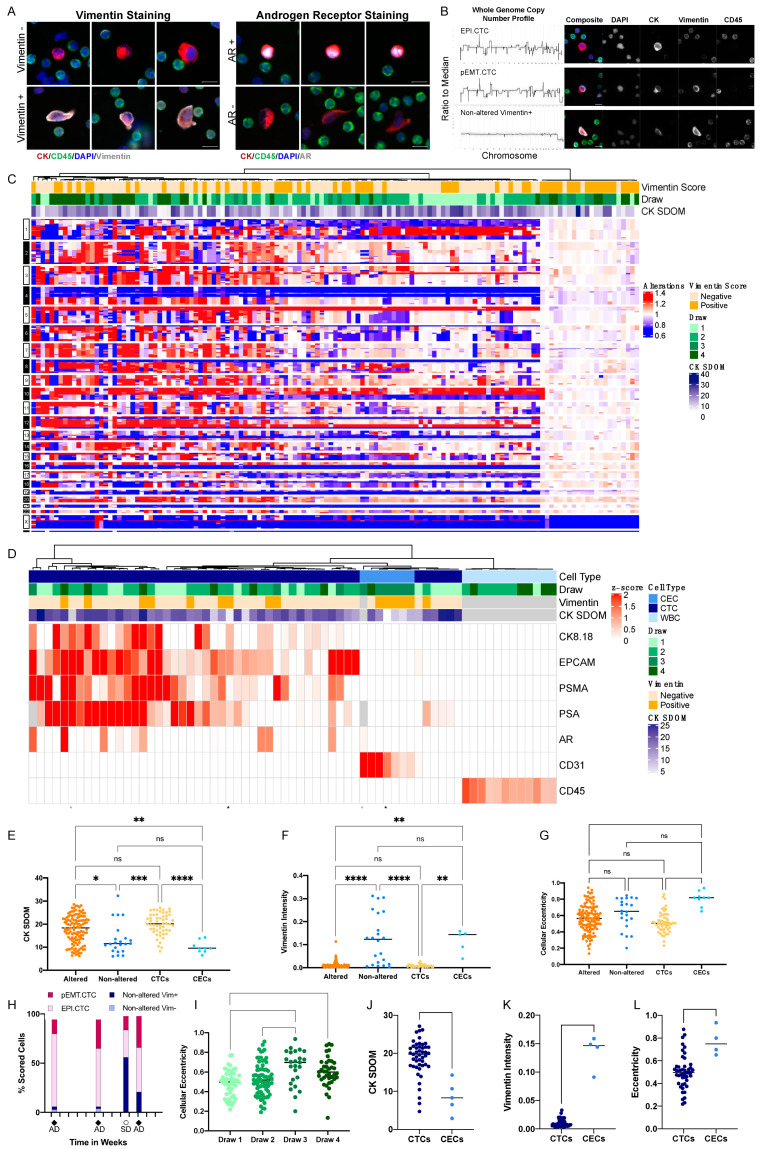
Figure 2.
Longitudinal assessment of circulating rare cells in a patient with metastatic prostate cancer (PC1). (A) Representative cells organized by their Vim and AR expression. (B) CNA profiles together with IF images of the representative copy number of altered Vim− EPI.CTCs, copy number of altered Vim+ pEMT.CTCs and non-altered Vim+ CECs. (C) Copy number alterations of rare cells across four blood draws. (D) Multiplex protein expression of rare cells and CD45+ white blood cells across four blood draws. Cells with no Vim score available are color-coded grey in the top heatmap annotation. (E) CK intensity measured as standard deviation over the mean (SDOM). (F) Vim intensity and (G) cellular eccentricity from immunofluorescence image analysis of all cells with downstream NGS or multiplex proteomic data. Cells were scored as either clonal or non-altered based on the CNV profiles or as CTC or CEC based on the results from targeted proteomics. The Kruskal–Wallis test with Dunn’s correction for multiple comparisons was used to test for differences between each group. p-value annotations: 0.1234 (ns), 0.0332 (*), 0.0021 (**), 0.0002 (***), <0.00001 (****). (H) Longitudinal assessments across four blood draws. Cells were grouped by EPI.CTC (clonal, Vim−), pEMT.CTC (clonal, Vim+), and CEC (genomically non-altered, morphologically consistent with endothelial cell). Tick marks on the x-axis were set to 4-week intervals. Percentages of cell types might differ slightly between the total cells found per draw by the imaging microscope and those sequenced, as not all cells can be sequenced, and the sequenced cell population is, hence, a subset of the total cells detected. (AD = Active Disease; SD = Stable Disease). (I) Cellular eccentricity of CTCs and CECs per draw of cells that underwent IMC. (J) CK SDOM, (K) Vim intensity and (L) cellular eccentricity of CTCs and CECs across draws analyzed by multiplex proteomics. Scale bars are 10 μm.

