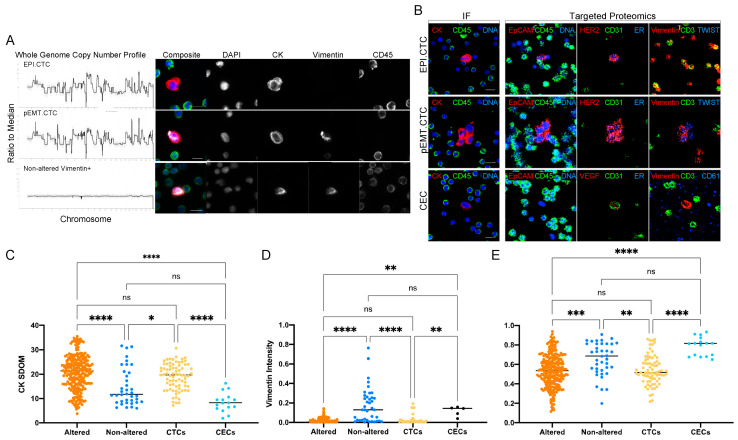
Figure 5.
Morphometrics and multi-omics (A) CNA profiles together with IF images of representative EPI.CTC, pEMT.CTC and non-altered Vim+ cells from breast cancer patients BC 1–6. (B) Protein expression of representative EPI.CTC, pEMT.CTC and CEC by IF and targeted proteomics from patient BC 2. (C) CK SDOM, (D) Vim intensity and (E) cellular eccentricity of rare cells from all breast and prostate cancer patients (BC 1–9 and PC 1–4) assessed by CNV and IMC. Eccentricity is determined on a scale of 0–1, where 0 = circle and 1 = ellipse. The Kruskal–Wallis test with Dunn’s correction for multiple comparisons was used to test for differences between each group. p-value annotations: 0.1234 (ns), 0.0332 (*), 0.0021 (**), 0.0002 (***), <0.00001 (****). Scale bars are set to 10 μm.

