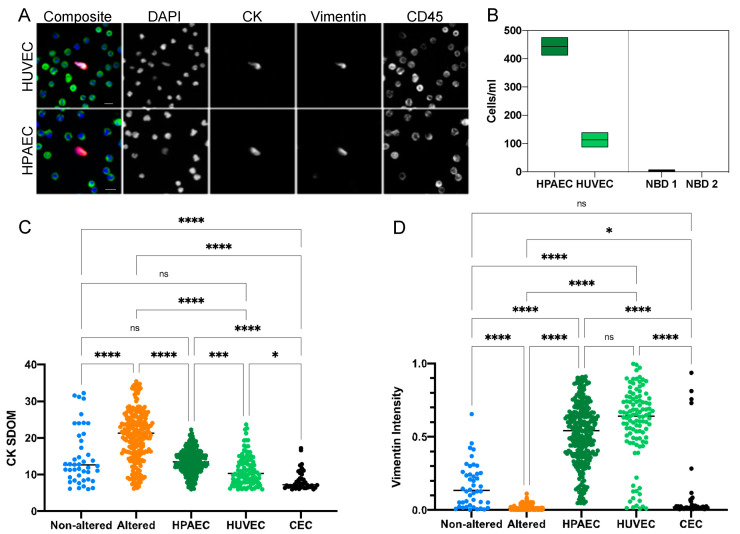
Figure 6.
Comparison of endothelial cell lines with cells detected in MI and cancer patient blood samples. (A) Representative immunofluorescent images of HPAEC and HUVEC cell-line cells spiked into a NBD. (B) Rare cell enumeration of HPAECs and HUVECs compared to rare cells detected in NBD controls. HPAECs were spiked at approximately 430 cells/mL and had a recovery of 103%. HUVECs were spiked at approximately 100 cell/mL and had a recovery of 113%. (C) CK SDOM and (D) Vim signal intensity of spiked HPAECs and HUVECs cell line cells, CECs detected in MI patients, and CTCs and CECs detected in cancer patients. The Kruskal–Wallis test with Dunn’s correction for multiple comparisons was used to test for differences between each group. p-value annotations: 0.1234 (ns), 0.0332 (*), 0.0002 (***), <0.00001 (****). Scale bars are 10 μm.

