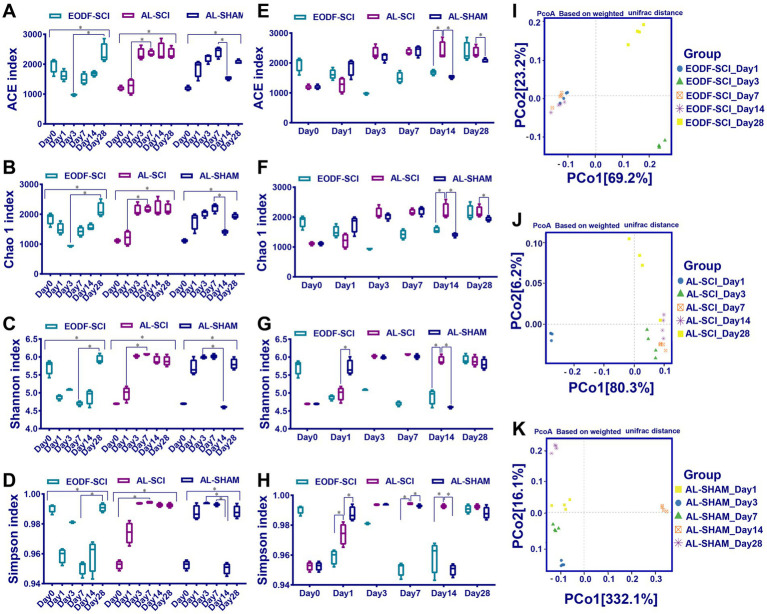
Figure 3.
Changes in gut microbiota diversity over time. (A–D) Chao 1, ACE, Shannon, and Simpson indices assessing α-diversity over time between the EODF-SCI, AL-SCI, and AL-SHAM groups. Data were analyzed using the Kruskal–Wallis test with Dunn post-hoc tests. (E–H) Chao 1, ACE, Shannon, and Simpson indices assessing α-diversity at the same time points between the EODF-SCI, AL-SCI, and AL-SHAM groups. Data were analyzed using the Mann–Whitney U test. N = 4, *indicates that indices were significantly higher (p < 0.05). (I–K) Principal coordinate analysis assessing β-diversity over time in each group (n = 4).

