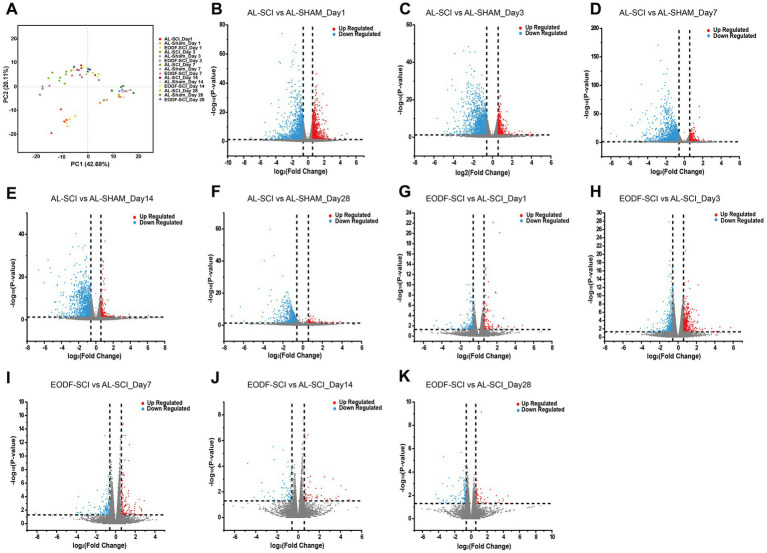
Figure 6.
Gene transcriptome analysis of spinal cord tissue. (A) PCA scores of EODF-SCI, AL-SCI, and AL-SHAM gene counts at different time periods. (B–F) DEGs of AL-SHAM vs. AL-SCI in each time period (p < 0.05 and |log2(foldchange)| > 0.58). (G–K) DEGs of EODF-SCI vs. AL-SCI in each time period (p < 0.05 and |log2(foldchange)| > 0.58).

