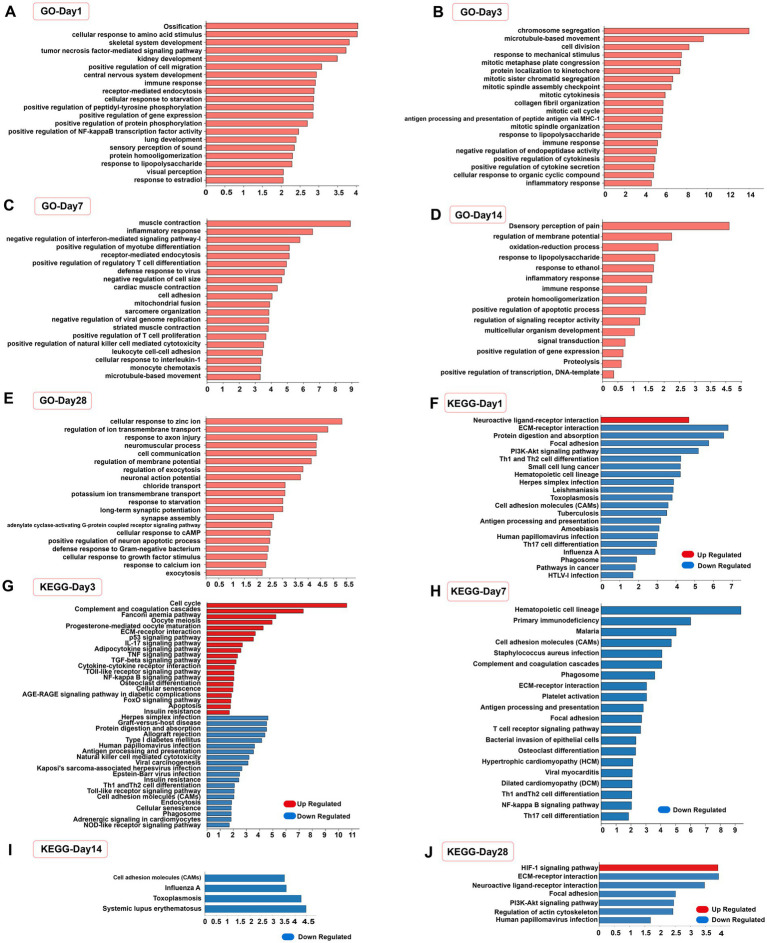
Figure 7.
Functional analysis of differentially expressed genes. (A–E) Top 20 significantly enrichened GO terms in biological process (number of genes >3) of the EODF-SCI group versus the AL-SCI group at different time periods. (F–J) Top 20 significantly enriched KEGG pathways of up-regulated and down-regulated DEGs at different time periods.

