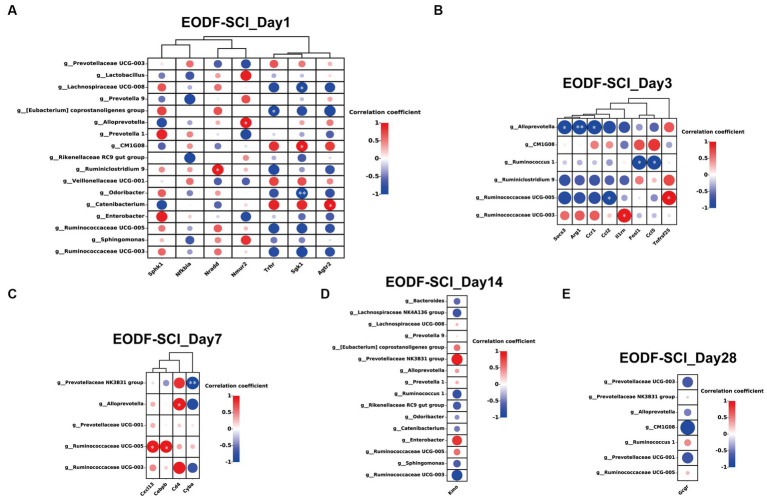
Figure 9.
Association between gut microbiota (genera with significant differences from the AL-SCI group) and neuroprotection-related DEGs. (A) EODF-SCI_Day1; (B) EODF-SCI_Day3; (C) EODF-SCI_Day7; (D) EODF-SCI_Day14; and (E) EODF-SCI_Day28. The color gradient illustrates the Spearman’s rank correlation coefficient: red indicates a positive correlation and blue indicates a negative correlation. *p < 0.05, **p < 0.01.

