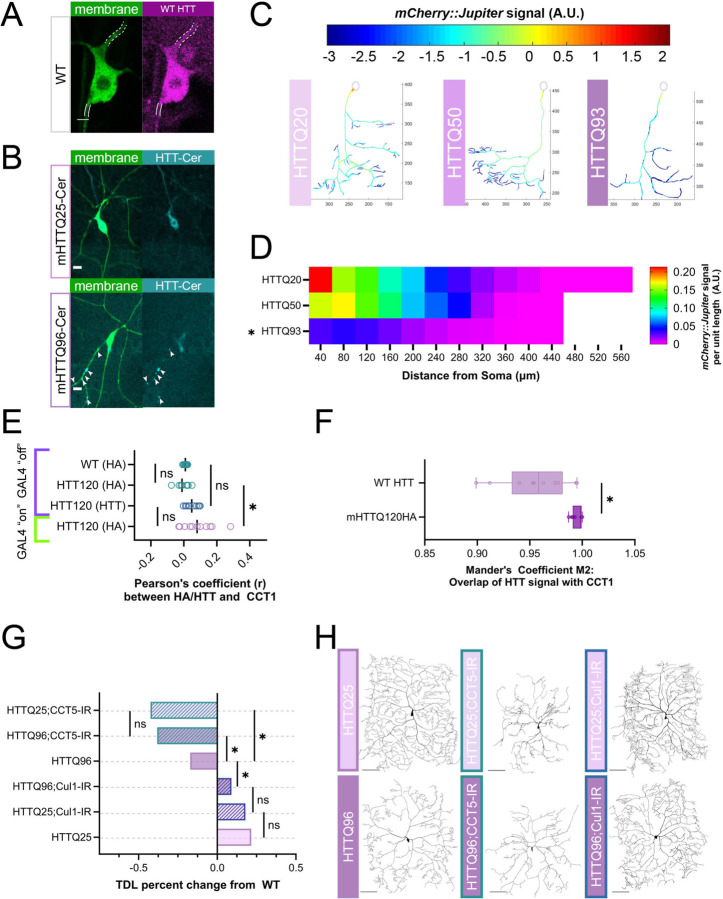
Figure 4: Expression of mHTT leads to dendritic hypotrophy parallel to TORC1 pathway.
(A) Representative image of WT HTT staining in CIV neuron – dendrite marked by dashed white lines, axon by solid lines. Scale bar = 3 μm. (B) Representative images of mHTT25-Cerulean and mHTT96-Cerulean shown with aggregate inclusion bodies marked by white arrows for mHTT96-Cerulean. Scale bar = 10 μm. (C) Representative reconstructions of branches from WT and TORC1 genetic manipulations – normalized mCherry::Jupiter fluorescence is coded with the rainbow spectrum shown (A.U.) (D) Heat map representing the average normalized, binned mCherry::Jupiter fluorescence along dendrites at increasing distances from the soma for overexpressions of mHTT 20, 50, and 93 repeats. Genotypes found to be significantly different along the dendritic arbor are marked with an asterisk. (E) Pearson’s correlation Coefficient (r) is near-zero for CCT1 and HTT co-expression in soma cytosol, however, r for CCT1-mHTT120HA is significantly higher than CCT1-WT HTT and HA-stained Gal4 “off” controls. (F) Thresholded Mander’s Coefficient M2 signifying overlap of two signals is significantly higher in CCT1-mHTT120HA conditions than CCT1-WT HTT conditions. (G) TDL of Cullin1-IR and CCT5-IR in both mHTTQ25 and mHTTQ96 backgrounds displayed as percent change from WT control. CCT5-IR decreases both mHTTQ96 and mHTTQ25 neurons to far lower than WT, while Cullin1-IR rescues mHTT96 hypotrophy to WT levels. (H) Representative images of CIV dendritic morphology in combined HTT and CCT5-IR or Cullin1-IR combinations. Scale bars = 100 μm. In all panels * = p < 0.05, see Supplementary Table S2 for detailed statistics.

