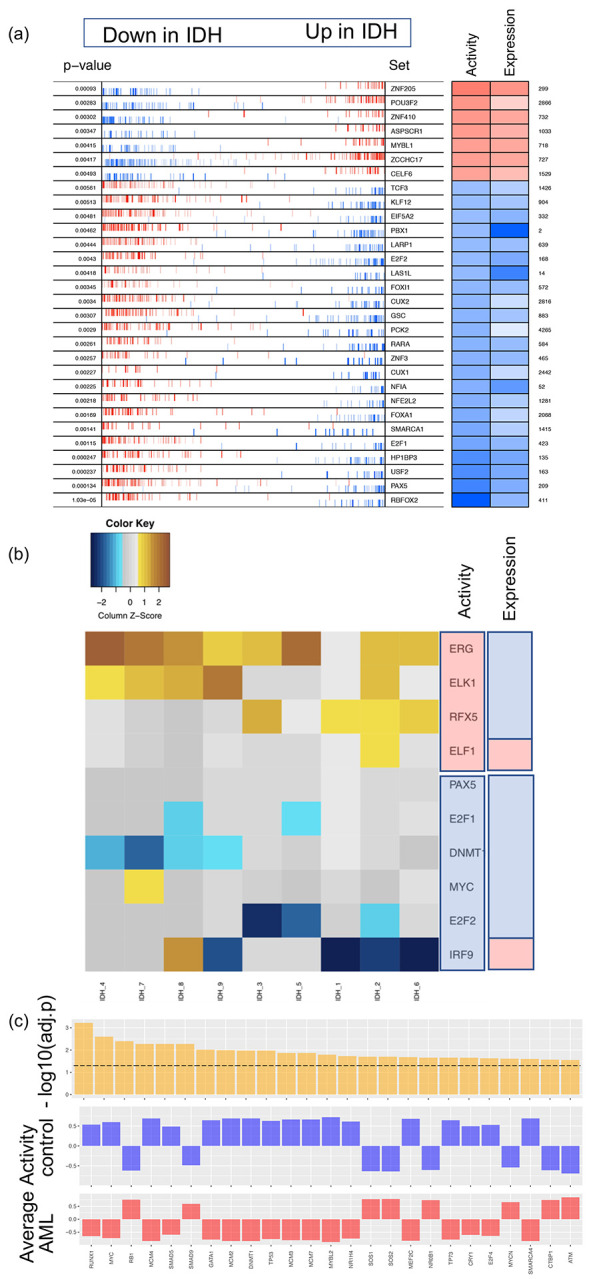
Figure 2. Enriched transcription factors identified from three different inference methods.

(a) VIPER: Left side of the plot shows the distribution of the positively (red) and negatively (blue) correlated targets for each selected TF on the gene list ranked from the one most down-regulated to the one most upregulated in AML samples with IDH mutations compared with the samples of normal control. The two-column heatmap on the right side shows the inferred differential activity (first column labeled as Activity) and differential expression (second column labeled as Expression). (b) RI: The heatmap shows the AML sample-specific lasso model coefficients for each selected TF. In the annotation bars from the right side, the first column shows the activity of the TFs, and the second column shows the gene expression of the TFs (pink denotes upregulation, and blue denotes downregulation). (c) NetAct: 1st row shows - log10(adjusted p-value) of the top 25 TFs ordered based on adjusted p-values; 2nd row shows the average activities of normal control samples; 3rd row shows the average activities of IDH samples. A horizontal dotted line represents adjusted p-value = 0.05.
