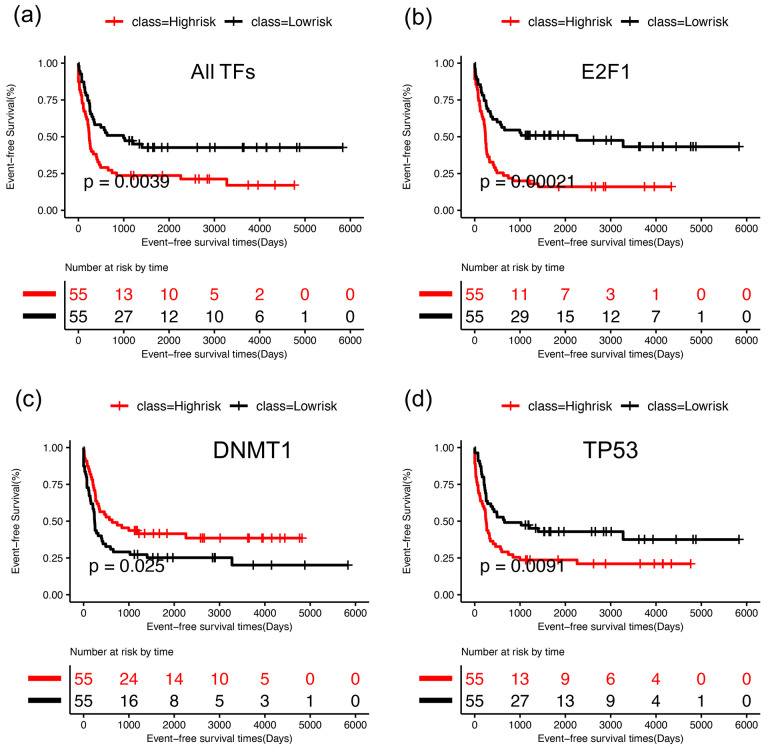
Figure 7. Survival Analysis of the optimal GRN.
For each TF, log-rank test was performed to group the patients as high (red) and low risk (black) based on median of risk scores and then Kaplan-Meier analysis was performed for survival analysis. (a) Kaplan-Meier curves for event free survival for E2F1 using nine IDH AML patients, (b) Kaplan-Meier curves of event free survival for E2F1 using 119 AML patients, (c) Kaplan-Meier curves for event free survival for NFIC using 119 AML patients, (d) Kaplan-Meier curves of event free survival for TP53 using 119 AML patients. See Fig. S4 for survival analysis for additional TFs using all 119 AML patients.

