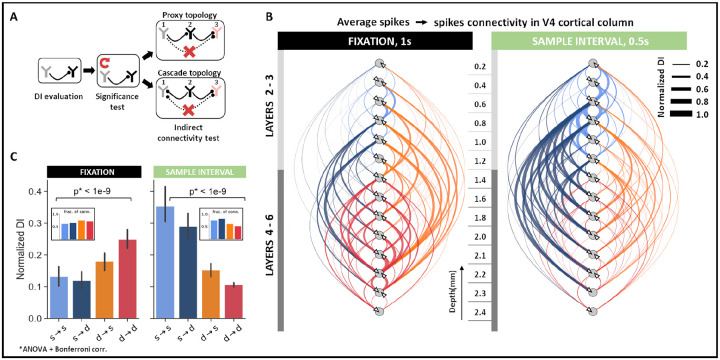
Figure 2: Spike–spike interactions within cortical columns of V4.
A, Schematic to determine direct connectivity between neurons. Significant connectivities were identified against shuffled spiking in the causal neuron for α = 0.05. Indirect connections were removed by systematically conditioning on neurons that formed cyclic connectivities. B, Direct causal influences between neurons in the V4 cortical column across all sessions (N = 123 units) during fixation (1s) and early sample (0.5s) intervals. Edges are weighted by the average DI between directly connected neurons at corresponding cortical depths. C, Connectivity trends between superficial (s, layers 2–3) and deep (d, layers 4–6) layer neurons in the fixation and early sample intervals. Mean ± SEM across all direct connectivity.

