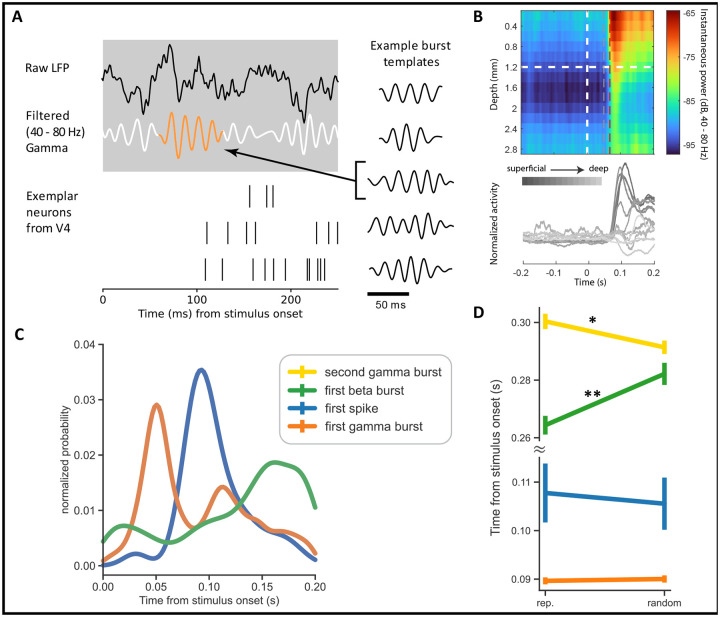
Figure 3: Visually evoked onset response latencies in V4 spiking and LFP activity.
A Zoom-in on neural activity after stimulus onset indicating the dynamics of raw LFPs (black), gamma oscillations (white), gamma bursting (orange) and spiking activity. Right column highlights template that maximally match the gamma burst along with other example templates. B Top: Trial averaged instantaneous power in the gamma frequency range of 40 – 80 Hz as a function of cortical depth. The plot also demarcates the time points associated with maximum probability of gamma burst initiation (gray dotted line) and half-power (red dotted line), respectively. Bottom: Peri-stimulus time histograms evaluated using rectangular smoothing for single neurons across the cortical depth. Exemplary plots from subject 2 and session 1.C, Distribution of time to first spike/burst in response to sample stimulus across all units and layers in V4. D, Signal response latencies separated into trials of randomized and repetitive stimuli (** p < 0.001). Error bars represent the 95% confidence interval.

