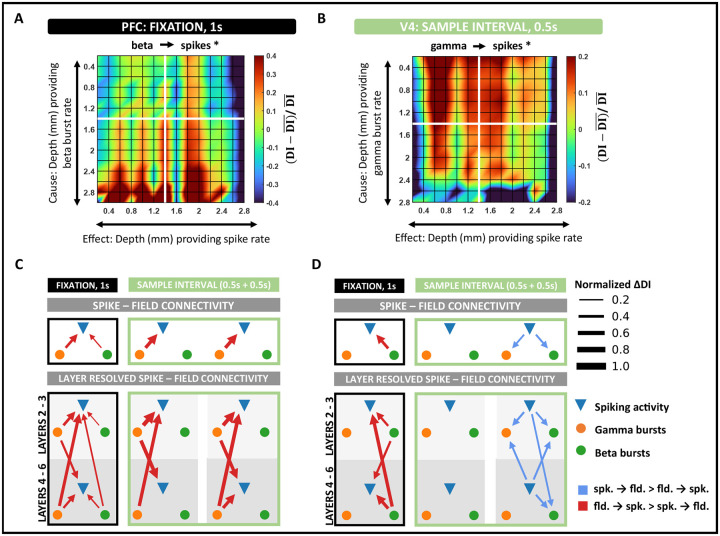
Figure 4: Spike–field interactions within cortical columns of V4 and PFC.
A, Layer-specific connectivity plot in PFC from beta to spiking activity during the fixation interval (black asterisk denotes significant connection, p < 0.001 and Cohen d > 0.2). Color scale indicates the deviation of DI from the global mean DI across all layers. B, Layer-specific connectivity plot in V4 from gamma to spiking activity in the early sample interval (black asterisk denotes significant connection, p < 0.001 and Cohen d > 0.2). C, Intra – column spike – field connectivity in V4 during fixation and sample intervals. Significant connections identified as the dominant DI in opposite directions, spikes → fields and fields → spikes (p < 0.001 and Cohen d > 0.2). Edges are weighted by the absolute value of the difference in DI between opposite directions. D, Same as C, but in PFC.

