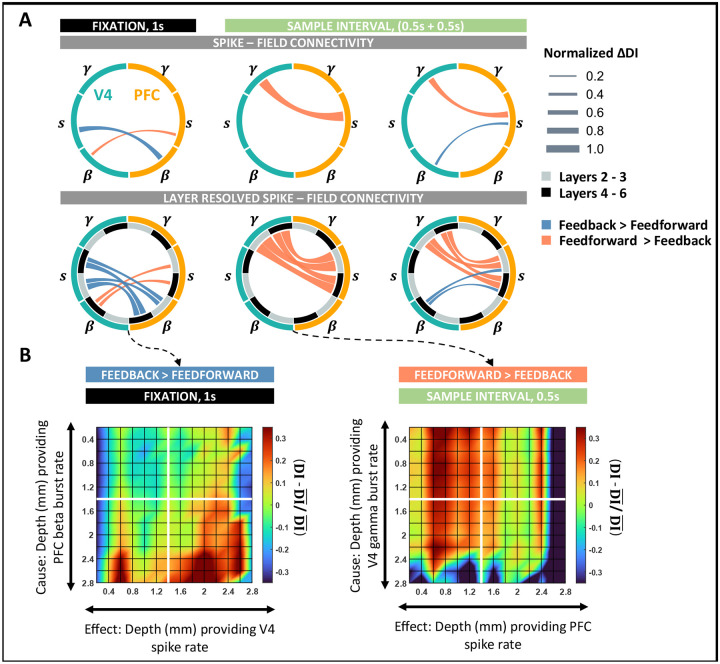
Figure 5: Spike–field interactions between cortical columns of V4 and PFC.
A, (Top) Wheel plots summarizing significant feedforward and feedback spike – field connections between V4 and PFC during the fixation and sample intervals. Significant connections identified as the dominant DI in either direction of V4 → PFC and PFC → V4. (Bottom) Spike–field connectivity patterns between V4 and PFC layer resolved to deep (4–6) and superficial (2/3) interactions. B, Layer-specific connectivity plots between V4 and PFC for the most significant connections during fixation and sample intervals. (Left) Feedback connection from beta bursts in PFC to spiking activity in V4 during fixation. (Right) Feedforward connection from gamma bursts in V4 to spiking activity in PFC during the early sample interval. Color scale indicates the deviation of DI from the global mean DI across all layers. All significant connections were tested at p < 0.001 and Cohen d > 0.2. Edges are weighted by the absolute value of the difference in DI between opposite directions.

