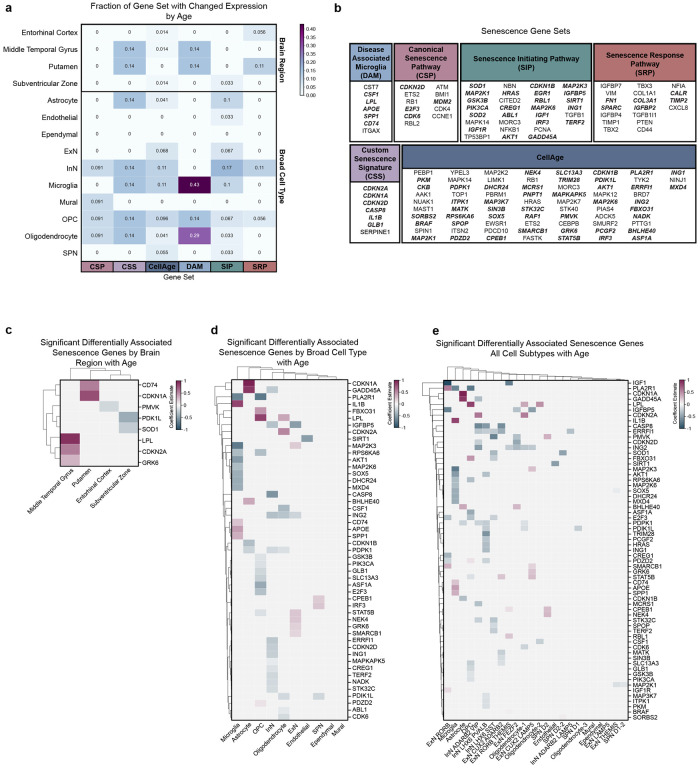
Figure 7: Scoring of senescence-associated gene sets at the level of brain region and broad cell types.
(a) Fraction of senescence associated gene sets changed with age across brain region and broad cell types
(b) Genes comprising senescence-associated gene sets used for scoring in (a). Genes in bold italics denote significant aDAGs
(c) Clustermap of significant aDAGs at the level of brain region with strength of association enumerated as coefficient estimate (magenta, significant positive association with age; blue, significant negative association with age). Brain regions ordered by hierarchical clustering.
(d) Clustermap of significant senescence-related aDAGs at the level of broad type. Broad types ordered by hierarchical clustering.
(e) Clustermap of significant senescence-related aDAGs at the level of cell subtypes. Cell types ordered by hierarchical clustering.
Abbreviations: CSP, canonical senescence pathway; CSS, custom senescence signature; DAM, disease-associated microglia; SIP, senescence initiating pathway; SRP, senescence response pathway

