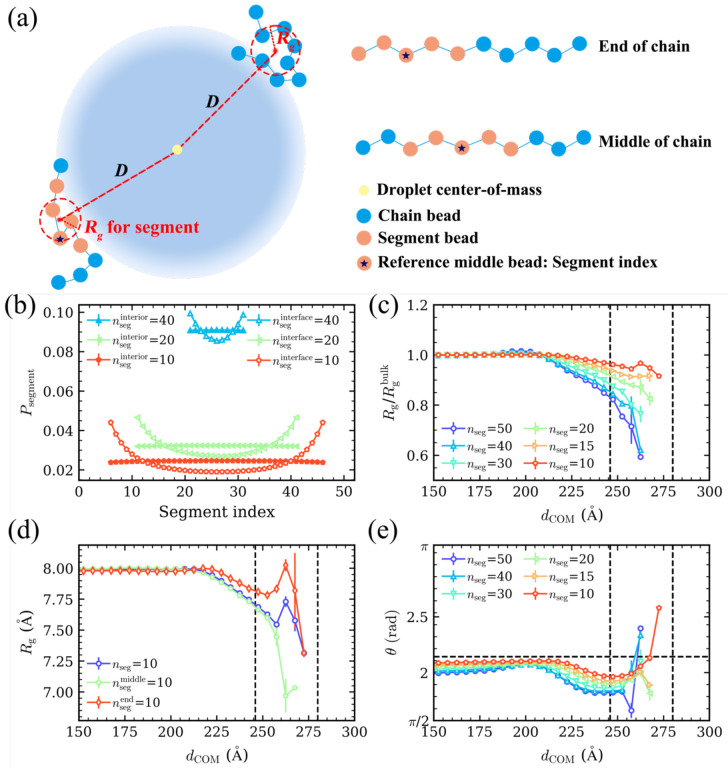
Fig. 3.
Segmental analysis. (a) Schematic diagram of the Rg calculation method for chains and their segments. Blue beads represent the chain monomers, while orange beads represent a specific segment. (b) Probability distribution of the segments for different segment lengths (nseg) at the interface (hollow symbols) and in the droplet interior (solid symbols). The segment index is represented by the index of middle bead of each segment (reference bead). When nseg is even, the larger index between the two middle beads is considered as the segment index. (c) Normalized average Rg of the different length segments with respect to dCOM. The black dashed lines represent the boundaries of the interface. (d) Rg of segments consisting of 10 monomers as a function of dCOM. The purple line represents for the average Rg for all segments in the chain of that length. The green and red lines represent the segments located at the middle and end of the chains, respectively. (e) Angle (θ) of the different length segments with respect to dCOM. The horizontal dashed line represents the average angle for isotropic distribution of segments.

