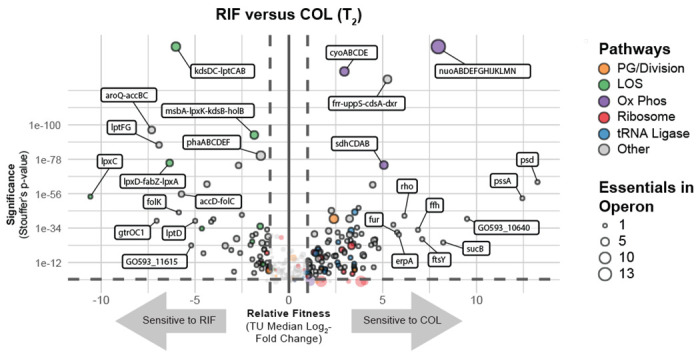
Fig 6.

Essential gene knockdown phenotypes in rifampicin (RIF) versus colistin (COL). Depletion of sgRNAs targeting transcription units (TUs) from the CRISPRi library during growth in inducer and RIF or COL at T2. Vertical dashed lines indicate a two-fold loss in fitness relative to non-targeting sgRNAs and horizontal dashed lines indicate a Stouffer’s p value of ≤ 0.05. Stouffer’s p values were calculated at the TU level by combining the false discovery rates (FDRs) of all individual sgRNAs targeting the TU. TUs related to pathways discussed in the text are colored according to the figure legend and the number of essential genes in a TU is indicated by point size.
