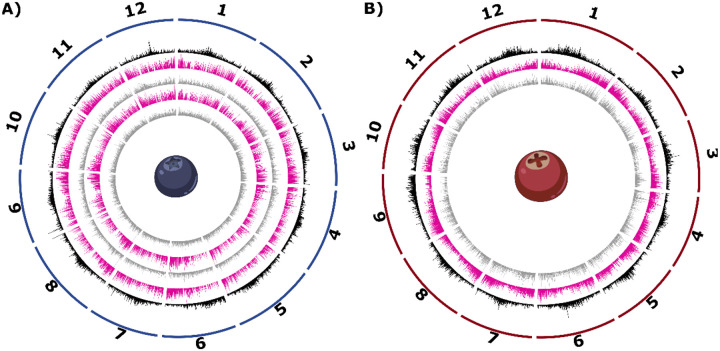
Figure 1: Circos plots for the blueberry and cranberry pangenomes.
Circos plots for the blueberry (panel A) and cranberry (panel B) pangenomes are shown. Tracks from exterior to interior are as follows: (1) karyotype of the 12 main pseudomolecules, (2) density of LTR transposons in black, (3) density of core genes in pink, and (4) density of auxiliary genes in gray. For panel A, northern highbush blueberry is shown on the third and fourth tracks, while the two innermost tracks reflect southern highbush blueberry core and auxiliary genes.

