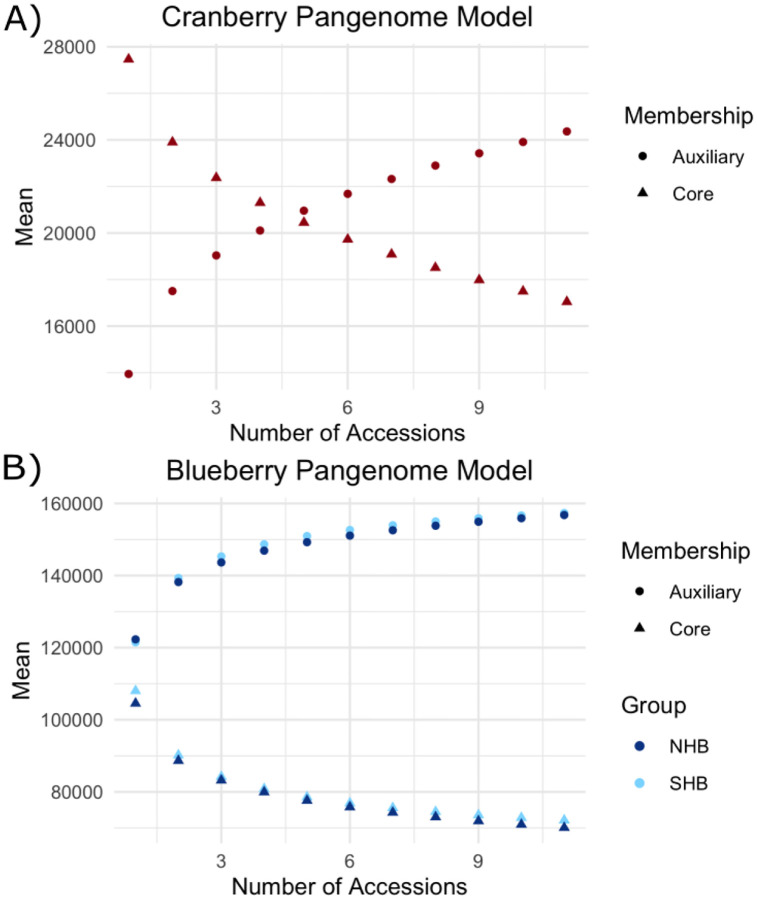
Figure 2: Core and auxiliary genome modeling for cranberry and blueberry.
Panel A depicts the model for the core (circle) and auxiliary (triangle) pangenome for cranberry. For each point along the x-axis, we take every possible combination of that size from our genome samples and plot the average number of core and auxiliary genes as a point. Panel B depicts the model for the core (triangles) and auxiliary genes (circles) for northern (dark blue) and southern (light blue) highbush blueberry. Note the y-axes do not start at zero.

