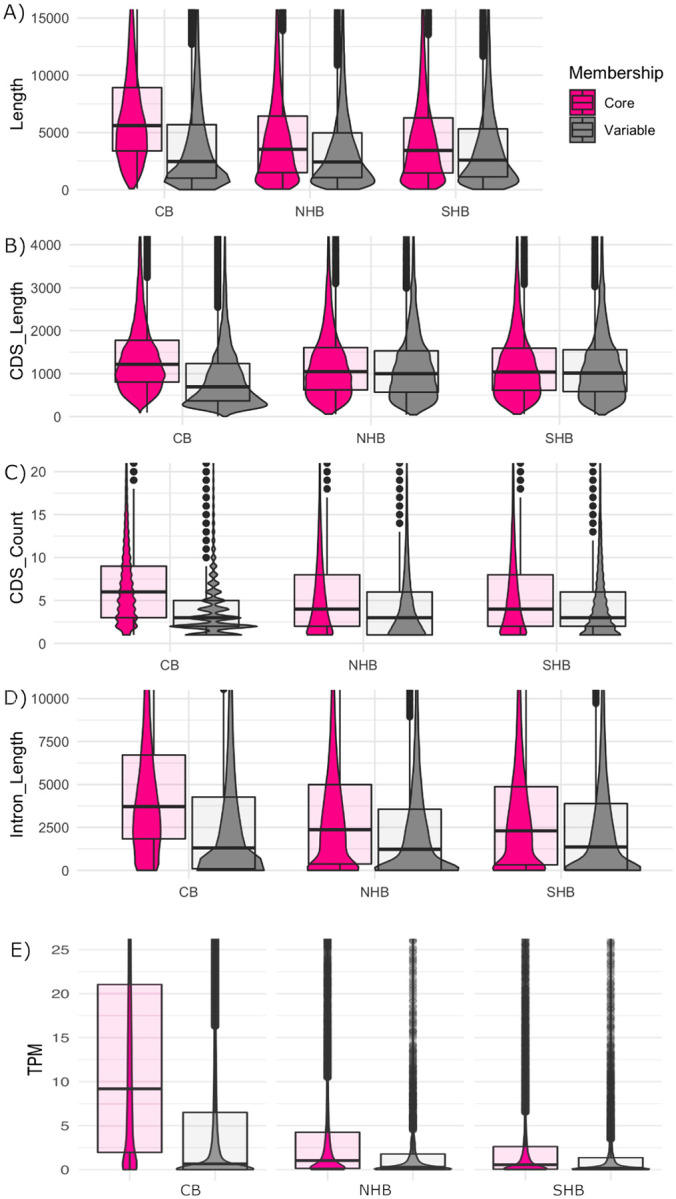
Figure 3: Differences between core and auxiliary genes.

Density plots showing the differences between core (pink) and auxiliary (gray) genes for cranberry (CB), northern highbush blueberry (NHB) and southern highbush blueberry (SHB). We compared (A) gene length (transcription start site to transcription end site), (B) coding sequence length (CDS) length, (C) CDS count, (D) intron length, and (E) fruit transcripts per million (TPM).
