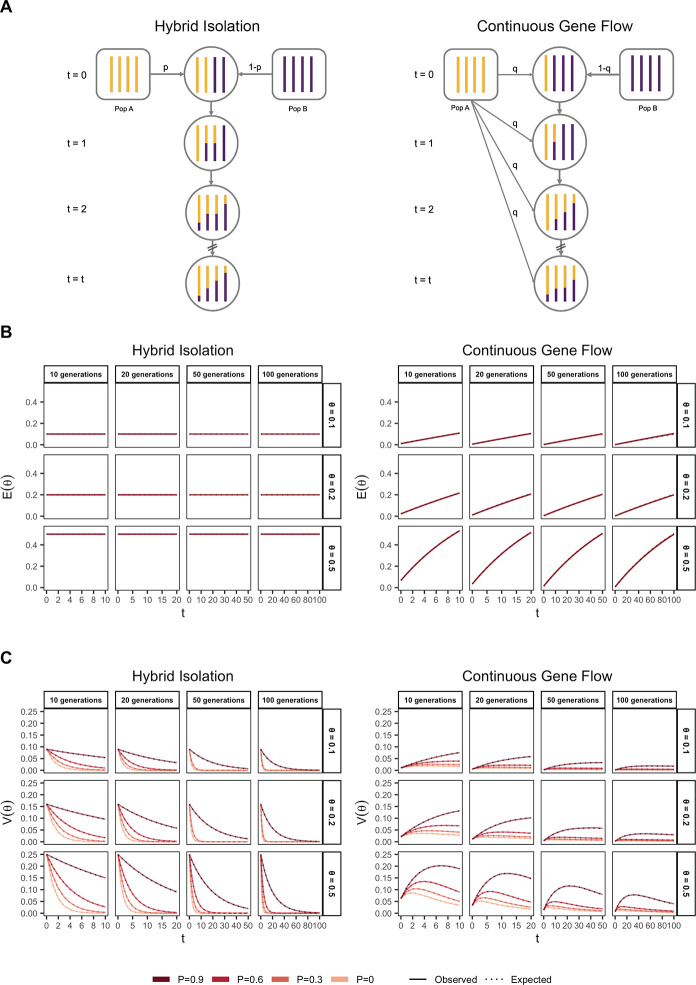
Figure 1:
The behavior of mean and variance of individual ancestry as a function of admixture history. (A) Shows the demographic models under which simulations were carried out. Admixture might occur once (Hybrid Isolation, HI, left column) or continuously (Continuous Gene Flow, CGF, right column). (B) The mean individual ancestry, remains constant over time in the HI model and increases in the CGF model with continued gene flow. (C) The variance in individual ancestry, is maximum at in the HI model, decaying subsequently. increases with gene flow in the CGF model and will subsequently decrease with time. measures the strength of assortative mating, which slows the decay of . is missing for simulations run for 50 and 100 generations and due to the difficulty in finding mate pairs (Methods).

