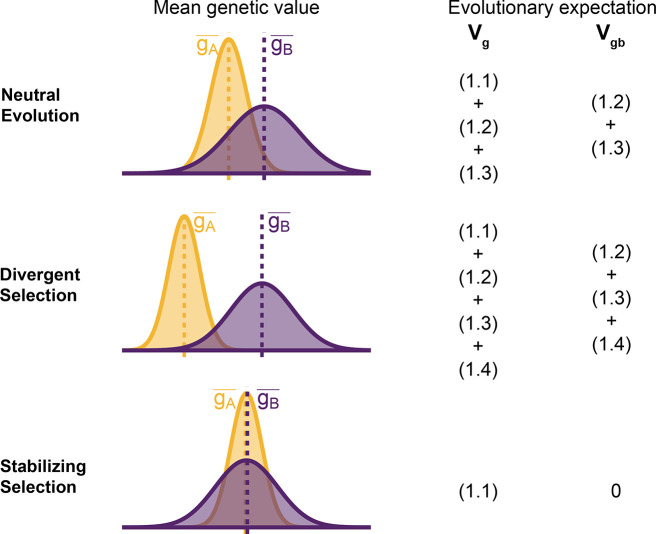
Figure 2:
Decomposing genetic variance in a two-population system. The plot illustrates the expected distribution of genetic values in two populations under different selective pressures and the terms on the right list the total and between-population genetic variance expected over the evolutionary process. For neutrally evolving traits (top row), we expect there to be an absolute difference in the mean genetic values that is proportional to . For traits under divergent selection (middle), is expected to be greater than that expected under genetic drift. For traits under stabilizing selection, will be less than that expected under genetic drift, and zero in the extreme case.

