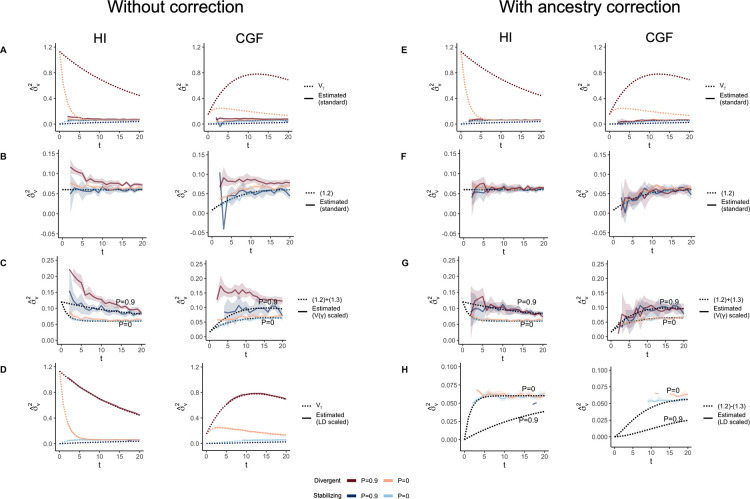
Figure 6:
The behavior of GREML estimates of the variance due to local ancestry in admixed populations under the HI (left column) and CGF (right column) models either without (A-D) or with (E-H) individual ancestry included as a fixed effect. The solid lines represent estimates from simulated data averaged across ten replicates with red and blue colors representing estimates for traits under divergent and stabilizing selection, respectively. P indicates the strength of assortative mating. The dotted lines either represent the expected variance in the population (A & B) or the expected estimate for three different ways of scaling local ancestry (B-D & F-H). (A-B & E-F) show the behavior of for the default scaling, (C, G) shows when local ancestry is scaled by the sample variance, and (D, H) when it is scaled by the sample covariance. Shaded regions represent the 95% confidence bands. Some runs in (D & H) failed to converge as seen by the missing segments of the solid lines because the expected variance in such cases was too small.

