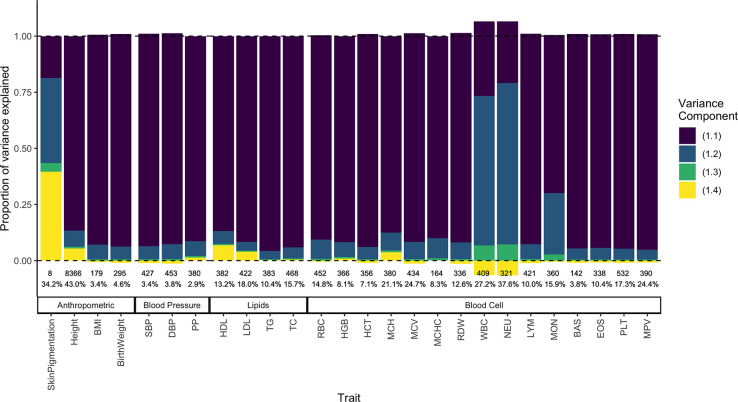
Figure 7:
Decomposing the genetic variance explained by GWAS SNPs in the 1000 Genomes ASW (African Americans from Southwest). We calculated the four variance components listed in Eq. 1, their values shown on the y-axis as a fraction of the total variance explained (shown as percentage at the bottom). The LD contribution, which can be positive or negative, is shown in yellow. The number of variants used to calculate variance components for each trait is also shown at the bottom.

