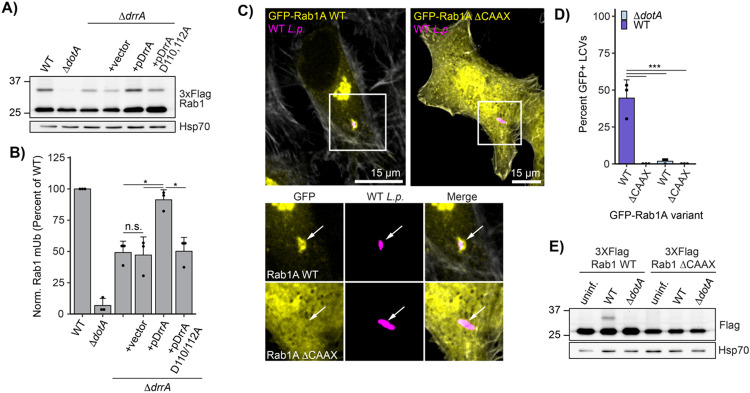
Figure 4: Rab1A is monoubiquitinated at the LCV membrane.
(A) Immunoblot analysis of lysates prepared from HEK293T FcγR transfected with 3XFlag Rab1A and infected with a ΔdrrA L.p. strain panel (WT, ΔdotA, ΔdrrA, and ΔdrrA complemented with empty vector or plasmid encoded DrrA WT or D110, 112A) for 1 hour (MOI=50). Monoubiquitinated Rab1 indicated with an arrow. (B) Quantification of biological replicates (N=3) of experiment shown in (A). Normalized Rab1A monoubiquitination intensity was calculated as a percentage of WT L.p. infection levels (see Methods). (C)-(D) Immunofluorescence analysis of EGFP Rab1A WT or ΔCAAX LCV recruitment. HeLa FcγR cells were transfected with indicated construct, then infected for 1 hour with either WT or ΔdotA L.p. (MOI=1), fixed, and stained with anti-Legionella antibody. (C) Representative images, and (D) quantification of EGFP positive LCVs (percent of total scored per biological replicate, n=3, 25 LCVs scored/replicate). (E) Immunoblot analysis of monoubiquitination of Rab1A WT vs ΔCAAX during L.p. infection . HEK293T FcγR cells were transfected with either 3X Flag Rab1A WT or ΔCAAX, then infected with WT or ΔdotA L.p. for 1 hour (MOI=50), or left uninfected. Lysates were probed with anti-Flag antibody. Monoubiquitinated Rab1 indicated with an arrow. For all graphs: bars represent mean value, error bars represent standard deviation. Individual points are values from each biological replicate. Statistical analysis of Western blot quantification: one-way ANOVA followed by Tukey-Kramer post-hoc test for each pair of means. * = p<0.05, n.s. = p>0.05.

