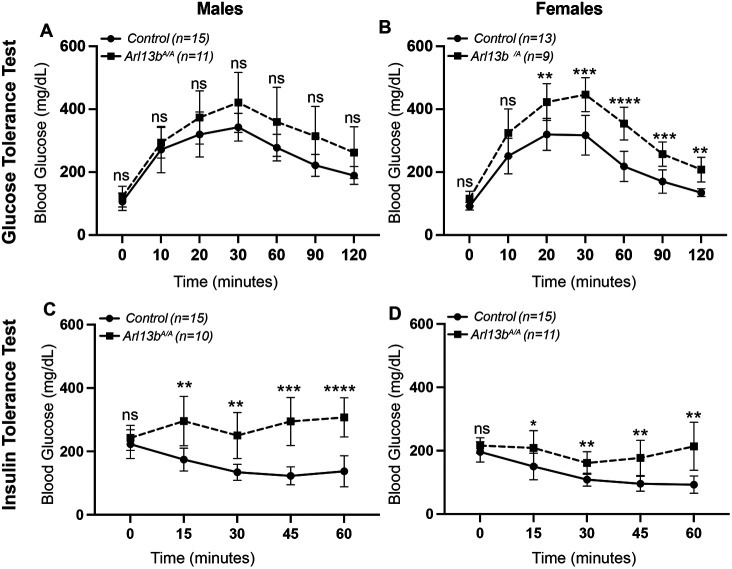
Figure 3: Arl13bV358A/V358A mice have impaired glucose and insulin metabolism.
For the glucose tolerance test, (A) male Arl13bV358A/V358A and control mice did not display a significant difference in blood glucose levels. (B) In contrast, blood glucose levels were significantly increased in female Arl13bV358A/V358A mice over controls beginning at 20 minutes post-glucose administration. For the insulin tolerance test, (C-D) both male and female Arl13bV358A/V358A mice had significantly higher blood glucose levels than controls at all time points post-insulin administration. Baseline blood glucose levels did not differ between the two genotypes in either males or females. The control group is comprised of pooled data from Arl13b+/+, Arl13bV358A/+, and Arl13bhnn/+ mice that did not differ in body weight. Error bars represent standard deviation. p-values < 0.05 *, < 0.01 **, < 0.001 ***, < 0.0001 ****; ns = not significant.

