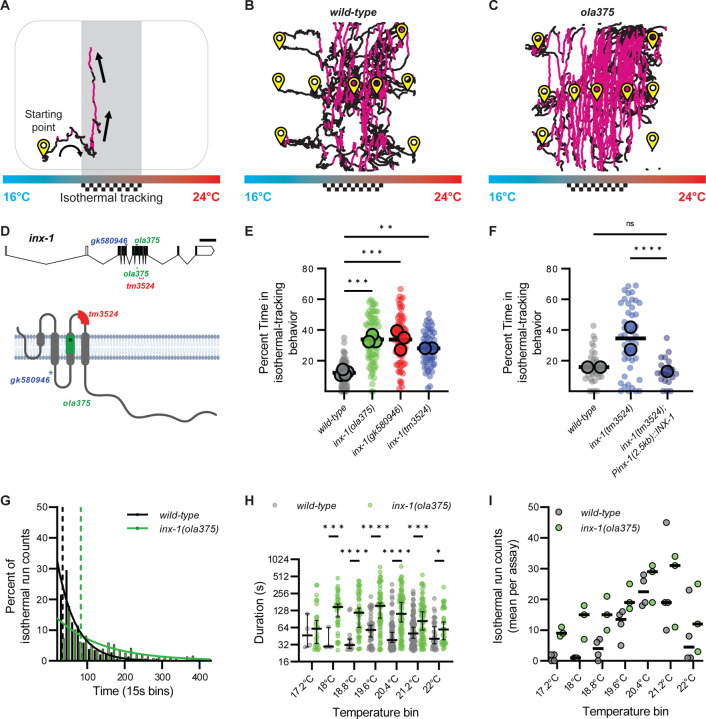
Figure 1. inx-1 mutants track isotherms at context irrelevant temperatures.
A. C. elegans track of a worm performing thermotaxis behavior. C. elegans perform two behavioral strategies during thermotaxis: gradient migration towards their preferred temperature and isothermal tracking at their preferred temperature. In the schematic, the preferred temperature region where animals are known to perform isothermal tracking is shaded and highlighted with a checkered goal pattern. Periods of isothermal tracking automatically recognized via a quantitative algorithm (see Methods) are highlighted in red. Arrows denote direction of travel. B. Representative image of wild-type worm tracks for animals trained at 20°C (checkered goal pattern). Animals start points denoted with yellow symbol. Animals were placed in an H-shape configuration in the gradient, as explained in Supplementary Figure 1 and Methods. Periods of isothermal tracking automatically recognized via a quantitative algorithm are highlighted in red C. As B, but for ola375 mutant worms isolated from a forward genetic screen. D. Molecular lesions present in inx-1 alleles, and their effects on the inx-1 gene and protein sequenc. The schematic uses inx-1a.1 isoform. Single nucleotide polymorphisms include A>G at position X:6,948,431 for inx-1(ola375) X; C>T at position X:6,949,062 for inx-1(gk580946) X). Insertion/deletions include a 16bp deletion at position X:6,948,406..6,948,421 for inx-1(ola375) X and 238bp deletion at position X:6,948,032..6,948,269 for inx-1(tm3524) X. Introduction of an early STOP codon in W127Opal for inx-1(gk580946) X, Y221Opal for inx-1(ola375) X. E. Percentage of time animals spend tracking isotherms (per worm track) for wild-type, ola375 mutants, and two independent inx-1 mutant alleles (inx-1(tm3524) X and inx-1(gk580946) X). Individual track values are presented by semi-transparent single-colored dots, while assay means are represented by bigger-size, slightly transparent circles with a black border. Colors denote genotypes. ** denotes P<0.005 and *** denotes P<0.0005 by Tukey’s multiple comparisons test after obtaining significance (P<0.0001) in a nested one-way ANOVA test. F. Percentage of time animals spend tracking isotherms, per worm track, for wild-type, inx-1(tm3524) X mutants, and inx-1(tm3524) X; olaEx2136 (inx-1 rescue). **** denotes P<0.0001 by Dunnetťs T3 multiple comparisons test after obtaining significance in both Brown-Forsythe (P<0.0001) and Welch's (P<0.0001) ANOVA tests on the individual tracks. Individual track values are presented by semi-transparent single-colored dots, while assay means are represeted with bigger-size, slightly transparent dots with a black borders. Colors denote genotypes. G. Histogram of the durations of wild-type (n = 288) and inx-1(ola375) X (n = 354) isothermal runs. Solid lines denote best-fit for one phase decay curves. Half-lives of the best-fit for one phase decay curves are 34.39 seconds for wild-type and 83.23 seconds for inx-1(ola375) X animals, denoted by the two vertical dotted lines. The time constants of the best-fit one phase decay curves are τ = 49.61 seconds for wild-type and τ = 120.1 seconds for inx-1(ola375) X animals, respectively. H. Semi-logarithmic (Y axis in log2) bee-swarm plot of isotherm-oriented run durations for wild-type and inx-1(ola375) X, per 0.5°C temperature bin. * Denotes q<0.05, *** denotes q<0.001, **** denotes q<0.00001 by multiple Mann-Whitney tests with a False Discovery Rate of 1% (using the Benjamini, Krieger, and Yekutieli method). I. Assay means of number of isotherm-oriented runs for wild-type and inx-1(ola375) X animals, per 0.5°C temperature bin.

