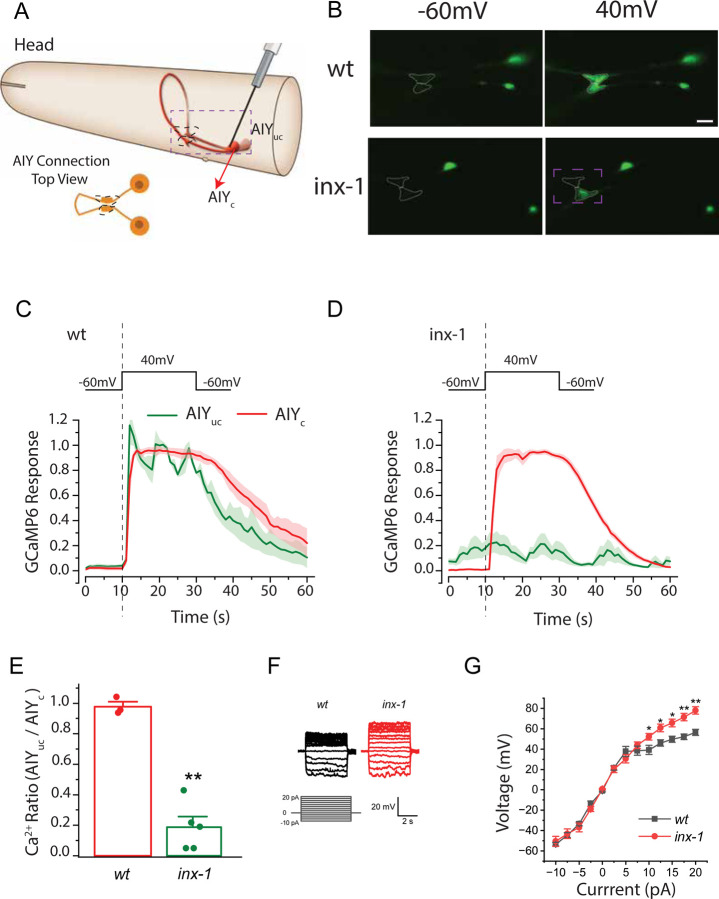
Figure 3. The bilateral pair of AIY interneurons are electrically coupled by INX-1 gap junctions.
A. Schematic of the C. elegans head and the bilaterally symmetric pair of AIY interneurons, with the clamped AIY (AIYc) and unclamped AIY (AIYuc). Dashed box represents imaged region in B. Images in B are from dorso-ventral views of the AIY pairs, schematized in lower left cartoon, with the synaptic region (called Zone 2) highlighted with dashed lines (as also in seen in B). B. Sample images of GCaMP6 fluorescence in the two AIYs before and during the 40-mV voltage step in wild type (wt) and inx-1(gk580946) mutants. Synaptic region (called Zone 2) of the two AIYs are marked by dotted lines (also in cartoon in A). Cell bodies are also visible to the right of the synaptic region. C. GCaMP6 signal strength over time in clamped AIY (AIYc) and unclamped AIY (AIYuc) of wild type animals. For results of individual animals normalized by the peak fluorescent signal of AIYc, see Supplementary Figure 2. D. As in (C), but for inx-1(gk580946) mutant animals. E. Comparison of the ratio (AIYuc/AIYc) of GCaMP6 signal. The ratio is the difference between the averages of AIYuc and AIYc over the 20 sec depolarizing period, and the preceding 10 sec hyperpolarizing period. wt (n = 3 animals) and inx-1 mutant (n = 5 animals). F. Sample membrane voltage traces in response to current injections for the indicated genotypes. G. Voltage versus current relationships of wild type (wt) and inx-1 mutants (n = 7 animals in both groups). The averaged membrane voltage over the last 4 sec of each current injection step (5 sec in duration) was used for quantification. The asterisks * and ** indicate statistically significant differences at p < 0.05 and p < 0.01, respectively (unpaired t-test).

