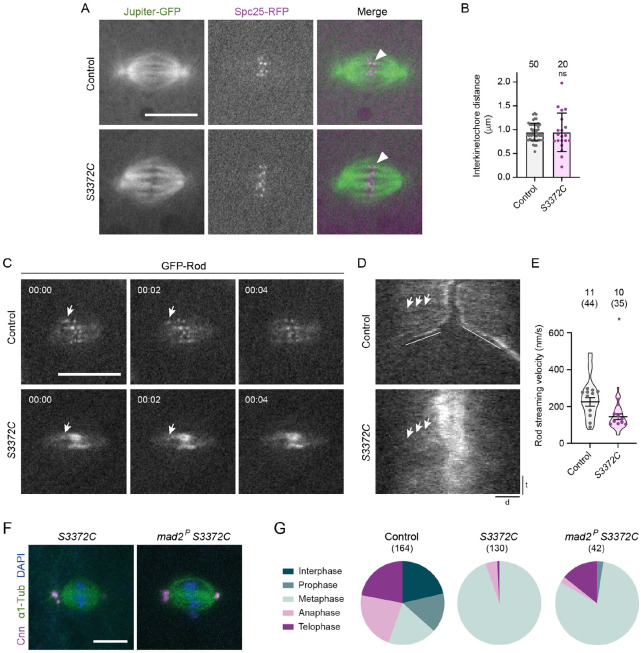
Figure 7. S3372C blocks mitosis in a SAC-independent manner.
(A) Example confocal images of mitotic spindles (single focal plane) in live control and S3372C embryos that have fluorescently-labeled microtubules (Jupiter-GFP) and kinetochores (Spc25-RFP). Arrowheads, examples of association of bundled microtubules with a kinetochore. (B) Quantification of interkinetochore distance (using centroids of Spc25-RFP signals) in live control and S3372C metaphase spindles. Columns show mean values; error bars represent S.D.; circles are values for individual kinetochore pairs. Number of kinetochore pairs analyzed (from 7 control and 8 S3372C embryos) is shown above bars. (C) Example stills from a time series (single focal plane) showing streaming (arrows) of GFP-Rod particles in control and S3372C embryos. Timestamps are min:s. (D) Example kymographs showing GFP-Rod streaming (e.g. arrows). d, distance; t, time. Diagonal lines in control label movements of kinetochores in anaphase. (E) Quantification of GFP-Rod streaming velocity. Violin plots show values for individual motile Rod particles and circles show mean values per embryo. Horizontal lines shown mean ± S.D. of values for individual motile particles. Numbers without parentheses above bars are number of embryos, with total numbers of particles given in parentheses. (F) Example confocal images of metaphase spindles from fixed embryos of S3372C and mad2P, S3372C mothers stained as indicated (Z-projections). (G) Incidence of mitotic stages in control, S3372C and mad2P, S3372C embryos (25 – 130 minute collection). Numbers in parentheses indicate number of nuclei or spindles counted per genotype; data are from 34 control, 49 S3372C and 33 mad2P, S3372C embryos, with no more than 5 randomly selected nuclei or spindles analyzed per embryo. In B and E, statistical significance was evaluated with an unpaired t-test (in E, comparisons were between mean values per embryo). *, P<0.05; ns, not significant. Scale bars: A and C, 10 μm; D distance, 2 μm; D time, 30 s.

