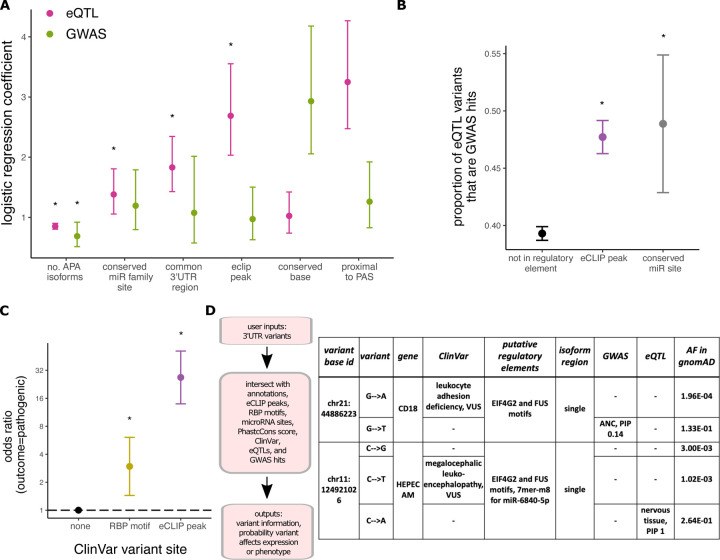
Figure 6: Characterization of 3’UTR variants into their annotations and regulatory elements helps prioritize variants for functional analysis and disease classification.
A Exponential of logistic regression model coefficients with 95% confidence intervals. The model independent variable is binary (PIP greater or less than/equal to 0.5). * indicates P<0.05. BIntersection of eQTL variants in different putative regulatory elements with GWAS hits. C Odds of a ClinVar 3’UTR variant in RBP motifs or eCLIP peaks being pathogenic versus variants not in a predicted regulatory element; shown is odds ratio with 95% confidence intervals. D RegVar workflow and example output for two ClinVar 3’UTR variants of uncertain clinical significance (genomic coordinates are in hg38).

