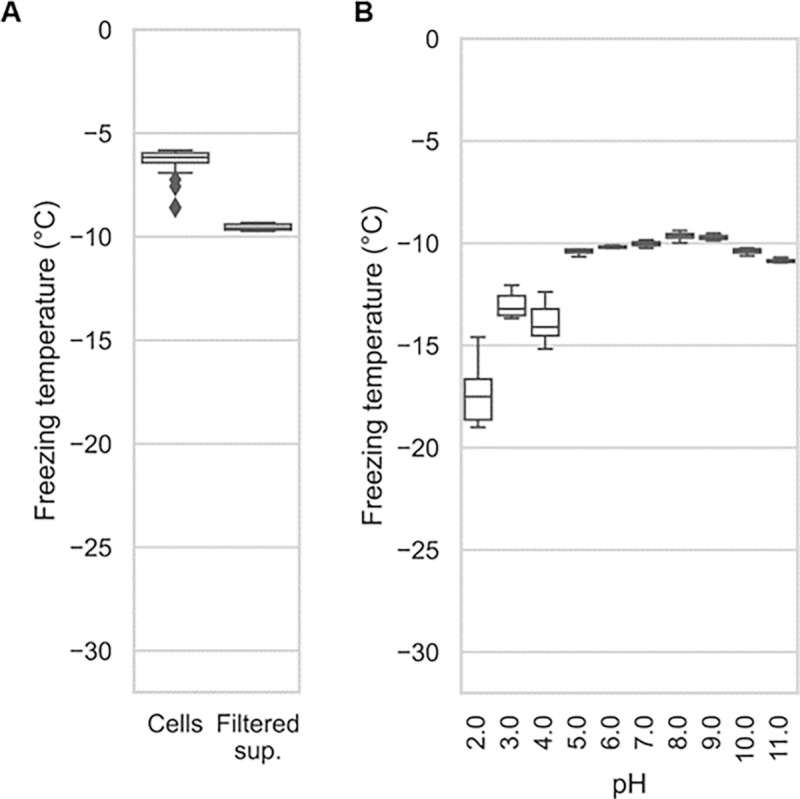
Figure 5.

A) A comparison of the nucleation temperatures of PbINP when assayed using intact E. coli cells and when assayed with filtered supernatant. B) A box and whisker plot showing the nucleation temperatures of filtered supernatant containing PbINP under different pH conditions. Boxes and bars indicate quartiles, with medians indicated by a centre line. Outliers are indicated by diamonds.
