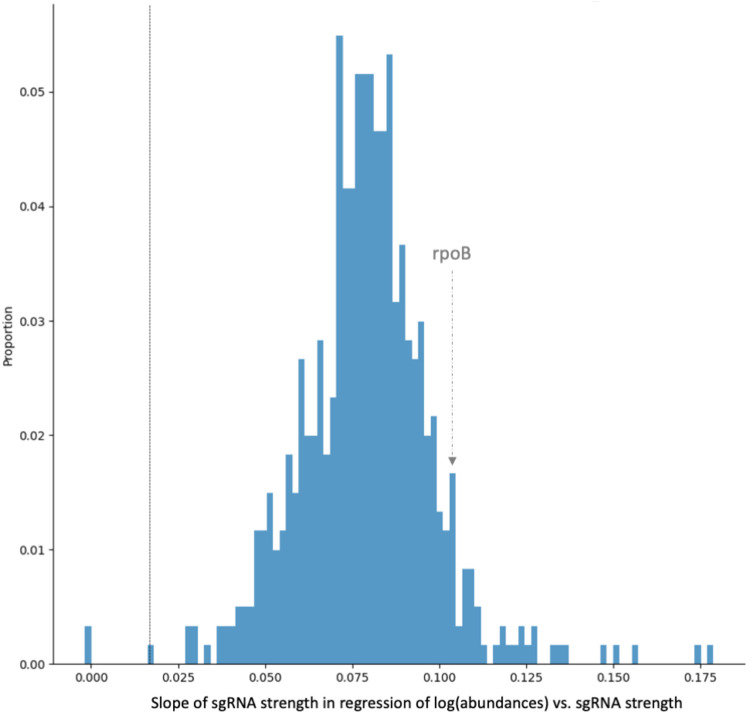
Fig 4. Distribution of slopes from regression of log10 (abundances) with respect to sgRNA strength, fit for the RIF D5 dataset.
For essential genes in the RIF (D5) experiment with at least 20 sgRNAs, we regressed the average log normalized relative abundance at no-drug control samples against the sgRNA strengths (extrapolated LFCs at 25 generations) and plotted a histogram of the coefficients. sgRNAs that are significant are those with slope >= 0.024 (adjusted p-value < 0.05). Most of the slopes are greater than 0 and marked as significant. As sgRNA strength increases for a mutant, abundance decreases, indicating a direct relationship between sgRNA strength and mutant depletion.

