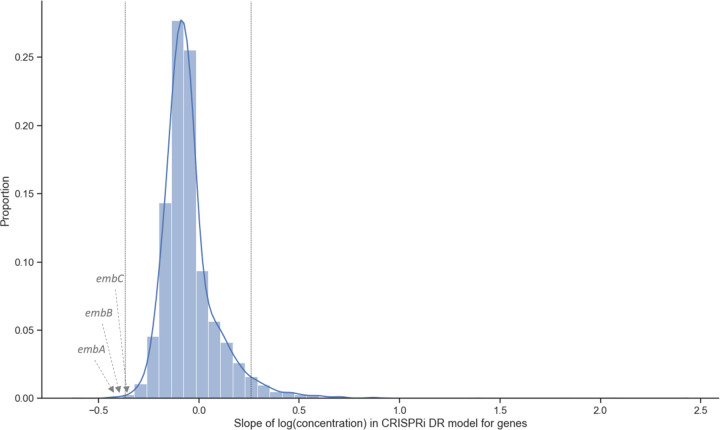
Fig 3. Coefficients of concentration-dependence from CRISPRi-DR model fitted for EMB D1 (1 day of pre-depletion).
The distribution of the slopes of concentration dependence, extracted from the model fit for each gene. The vertical lines are at slope = −0.37 and slope = 0.26. These are the slopes adjusted P-value < 0.05 and the |Z-score|> 2.0. 164 genes have significant slope values, i.e., 164 genes show a significant change in abundance with increasing EMB concentration while accounting for sgRNA strength.

