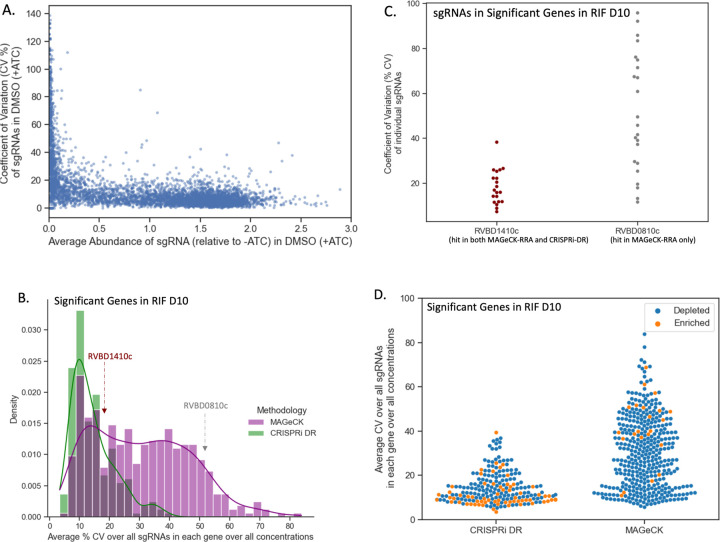
Fig 5. CRISPRi-DR model shows less sensitivity to noise than MAGeCK.
(A) Comparison of average relative abundance and average CV across replicates in no-drug control samples for a sample of sgRNAs: For each sgRNA, we looked at the average CV of sgRNAs in the 3 control replicates against the average abundance of the sgRNA across those replicates. The lower the average abundance, the greater the noise present for the sgRNA. (B) Distribution of average CV of gene for significant genes in MAGeCK and significant genes in CRISPRi-DR in RIF D10: The distribution of average CV of significant genes in CRISPRi-DR model is more skewed and has a peak at CV ≈ 10%. Although most significant genes in MAGeCK show an average CV around 15%, there are quite a few genes with higher average CVs not found significant by the CRISPRi-DR model. (C) Coefficient of Variation (CV) of each sgRNA in two genes with similar number of sgRNAs for a library treated with RIF D10: Rv1410c is significant in both methodologies and Rv0810c significant in MAGeCK but not in CRISPRi-DR. The majority of CV values for sgRNAs in Rv1410c is around 20%. Although both genes have about 20 sgRNAs, Rv0810c shows 8 sgRNAs whose CV values exceed 60.5%, which is the maximum CV present in Rv1410c. (D) Distribution of average CV for enriched and depleted significant genes in MAGeCK and CRISPRi-DR in a RIF D10 library. This plot shows the distribution plot of Panel B, separated by depletion, and enriched significant genes. The average CV values for significant genes in the CRISPRi-DR model are low for both enriched and depleted genes. As seen in Panel B, significant genes in MAGeCK show low average CV, but they also show high average CV. Although there is a substantially lower number of significantly enriched in MAGeCK, they still show a large amount of noise compared the significantly enriched genes in CRISPRi-DR model.

