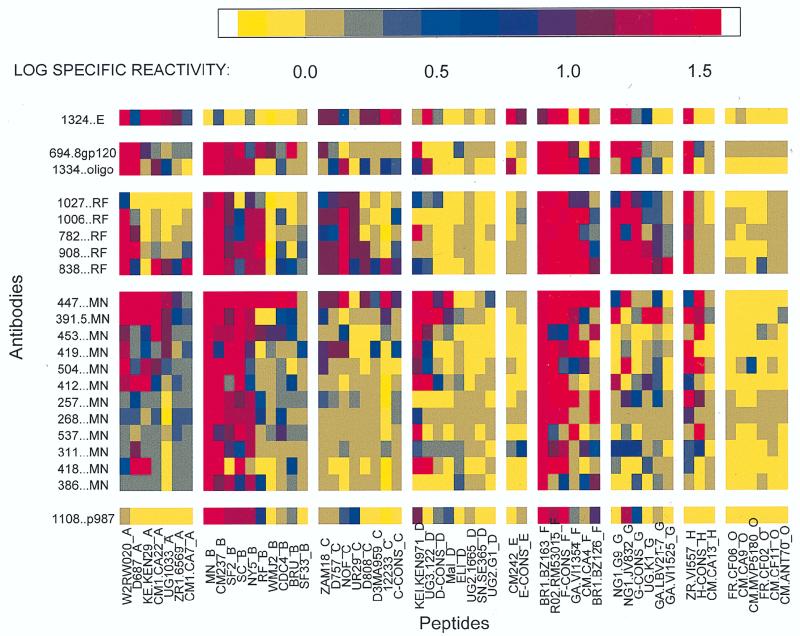
FIG. 1.
ELISA results of the reactivity of each V3 peptide with each of the human anti-V3 MAbs. The data are displayed as a matrix in which the spectrum of color shown at the top of the figure corresponds to the LSR, which is defined as log (ODexperimental MAb + peptide/ODcontrol MAb + peptide) for each of the 1,176 combinations of MAbs and peptides. The MAbs are listed vertically, and the suffix of each denotes the peptide or protein with which it was selected (see text). The peptides are listed horizontally, and each suffix denotes the clade of the virus from which the peptide was derived.

