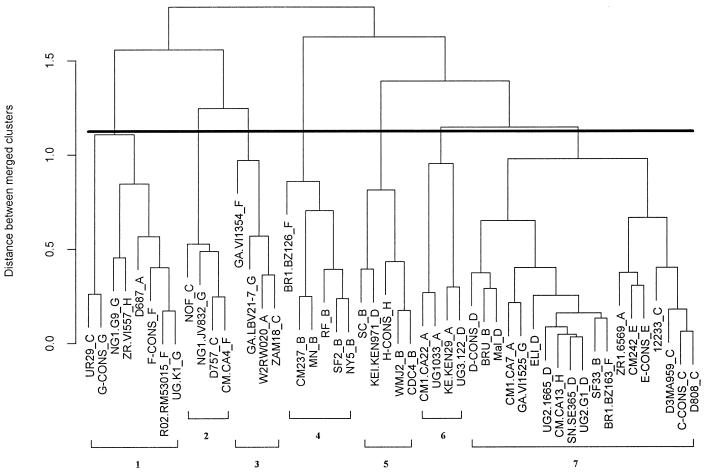
FIG. 4.
Dendrogram of 50 peptides showing their immunologic relationships defined by reactivities with the 21 anti-V3 MAbs. The dark horizontal line denotes the point in the tree at which Hartigan’s algorithm delineates the most appropriate number of clusters—seven in this case. Each cluster is numbered at the bottom of the figure. The vertical axis shows the distance between merged clusters measured in mean-squared LSR units. The clade of the virus from which each peptide was derived is shown as the last letter in each peptide designation.

